back
Synthesis and characterization of h-BN
How does speed of ball mill treatment of micron sized h-BN influence its characteristics?
Micron h-BN was annealed in vacuum at 1400°C for 4 h. Resulting powder was processed in vibrational ball mill at different speeds in Ar atmosphere, washed in water via centrifugation and dried in ambient.
The resulting powder becomes grey after ball-milling and the color is not uniform after drying. pH of suspension before wash is 9.
 |
|
 |
| dl100: 450 r.p.m. |
dl101: 600 r.p.m. |
dl102: 750 r.p.m. |
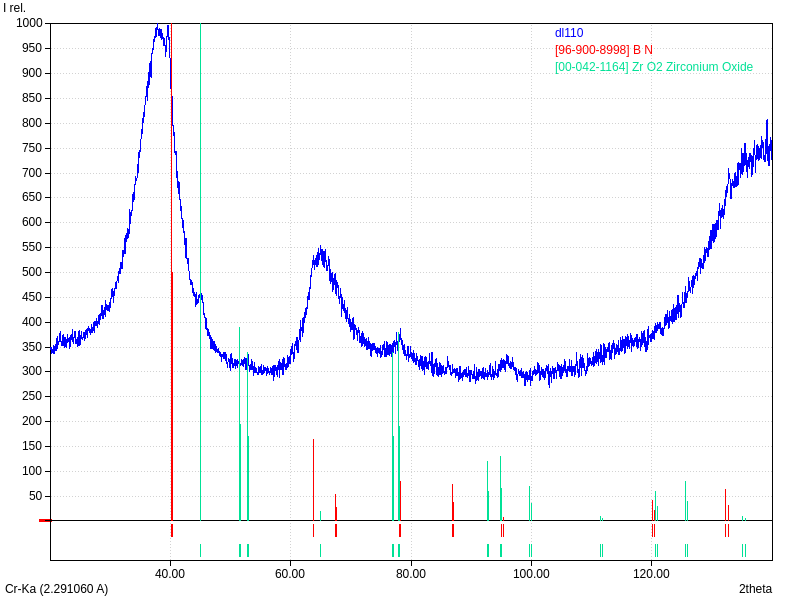
XRD
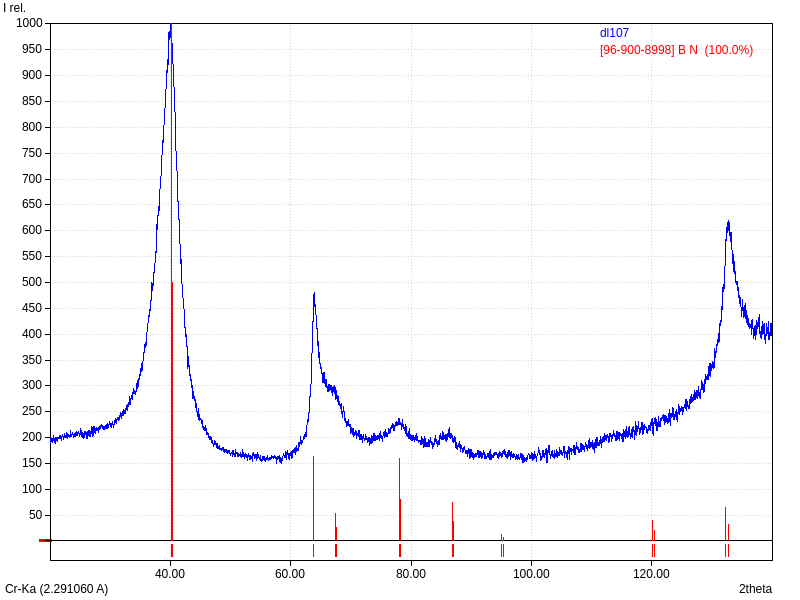
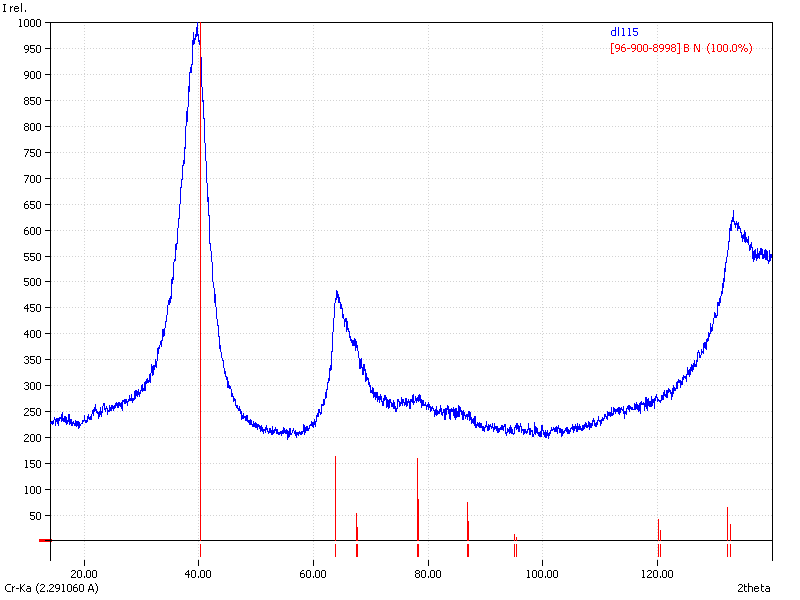
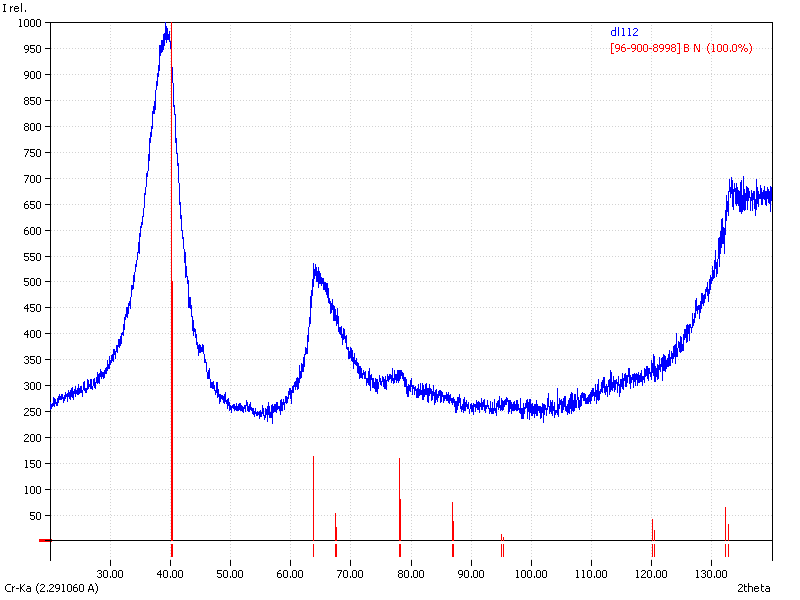
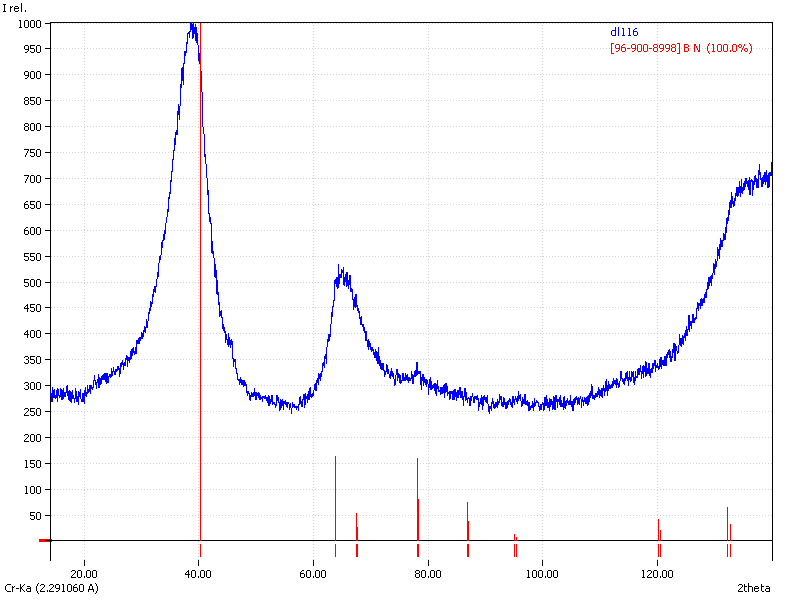
Samples consist of h-BN phase. Peak corresponding to (002) plane shifts towards lower 2θ which can be explained by the increase of interplanar distance. Also peaks becomes broader due to local strains and reduction of crystallite sizes.

FTIR
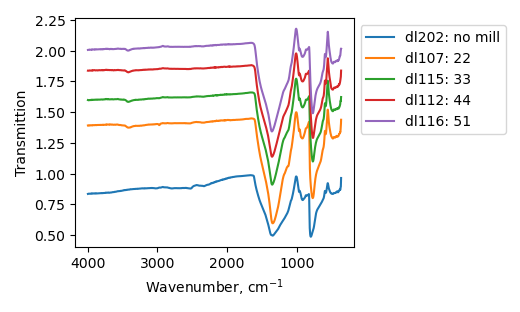
One can see on ftir spectra peaks corresponding to B-N-B stretching and B-N-B bending modes. The peaks become broader after ball-milling. Peak at 1333 cm-1 shifts to higher wavenumbers. 770 peak retains its position. Sample treated at 450 r.p.m. consist of peaks at 2332 and 2546 cm-1 which can be described by C-N stretching mode, however it is unclear where these groups come from. There are also peaks corresponding to O-H and N-H bonds and relative intensity of these peaks increases after the increase of ball-milling speed.

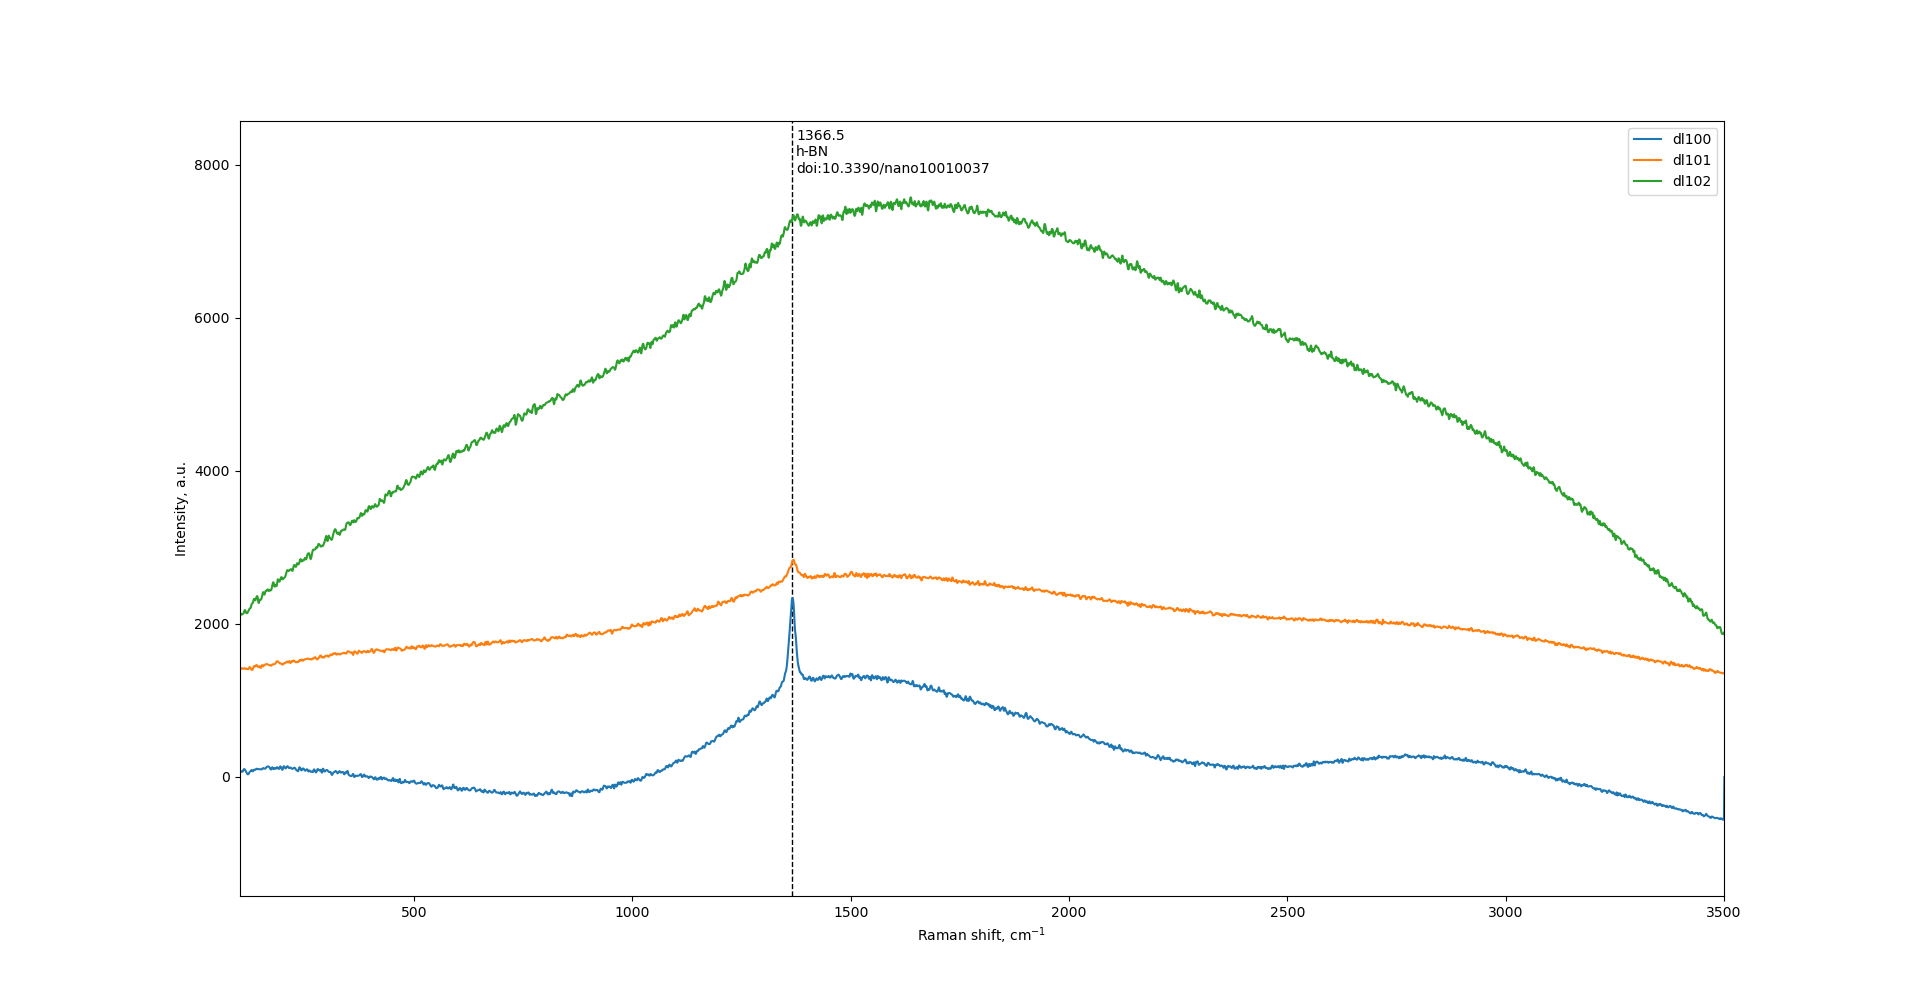
Raman
Increase of ball-milling speed results in decrease of h-BN peak intensity at 1366 cm-1. Also, there is substantial increase of wide halo.
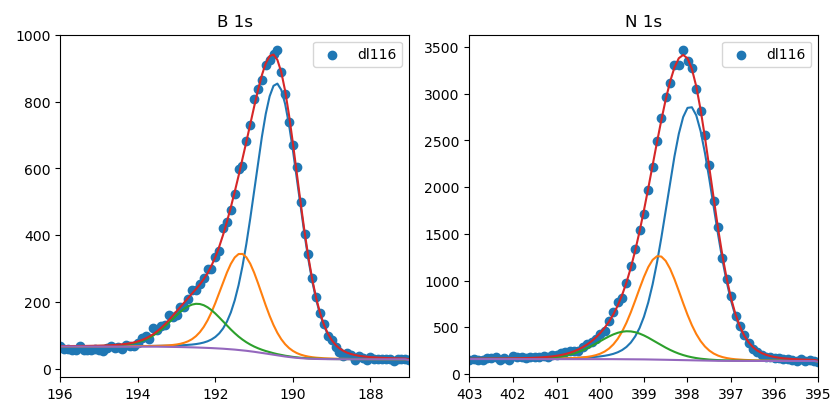
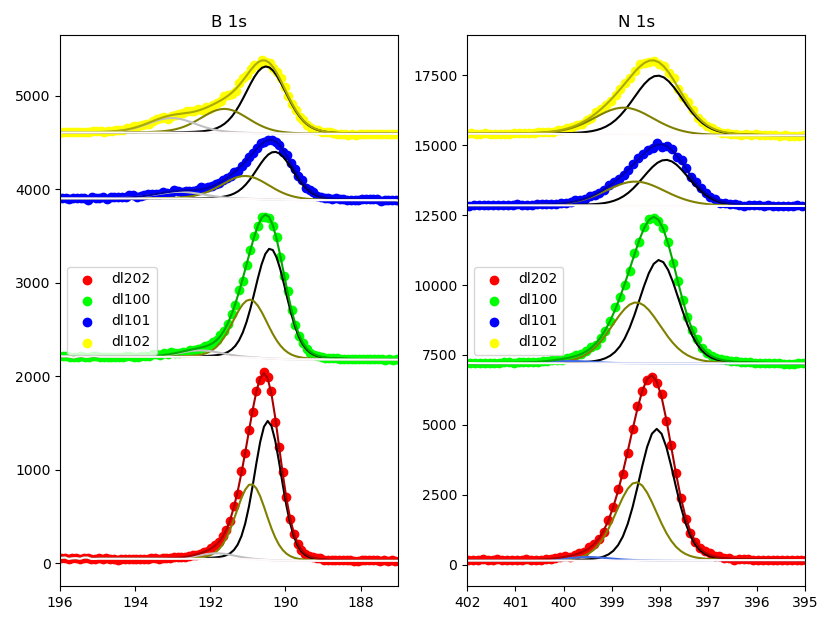
XPS
| Sample |
B |
N |
O |
N:B |
| dl202 |
53.34 |
44.31 |
2.35 |
0.8307 |
| dl100 |
53.04 |
41.93 |
5.03 |
0.7905 |
| dl101 |
48.70 |
37.94 |
13.36 |
0.7791 |
| dl102 |
48.71 |
34.49 |
16.80 |
0.7081 |
| Sample |
B 1s |
N 1s |
| B-N |
B-N-O |
B-O |
B-N |
B-N-O |
B-N-H |
| dl202 |
60.06 |
36.84 |
3.11 |
58.14 |
39.84 |
2.02 |
| dl100 |
60.13 |
35.21 |
4.66 |
57.34 |
41.38 |
1.28 |
| dl101 |
55.52 |
34.55 |
9.93 |
59.62 |
40.38 |
|
| dl102 |
59.20 |
25.33 |
15.37 |
64.83 |
35.17 |
|
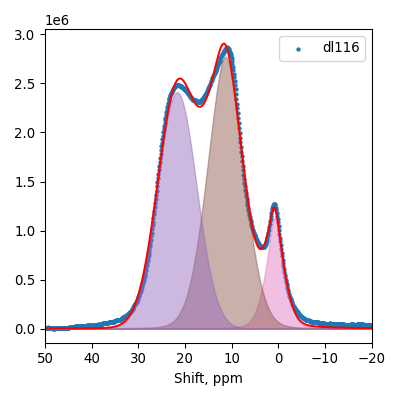
11B MAS NMR
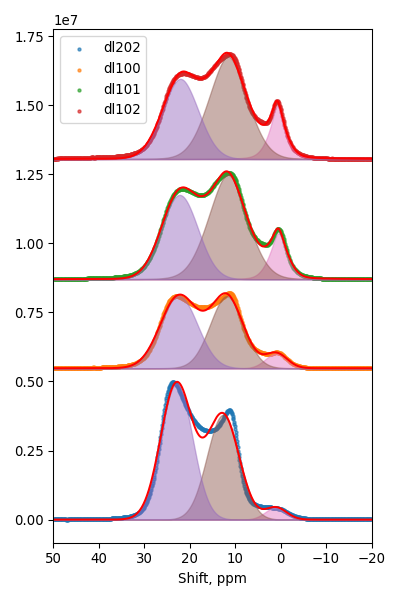
| Sample |
Milling speed |
BN |
BNO |
BO |
| dl202 |
0 |
0.54 |
0.42 |
0.04 |
| dl100 |
450 |
0.49 |
0.45 |
0.06 |
| dl101 |
600 |
0.38 |
0.51 |
0.11 |
| dl102 |
750 |
0.37 |
0.51 |
0.12 |
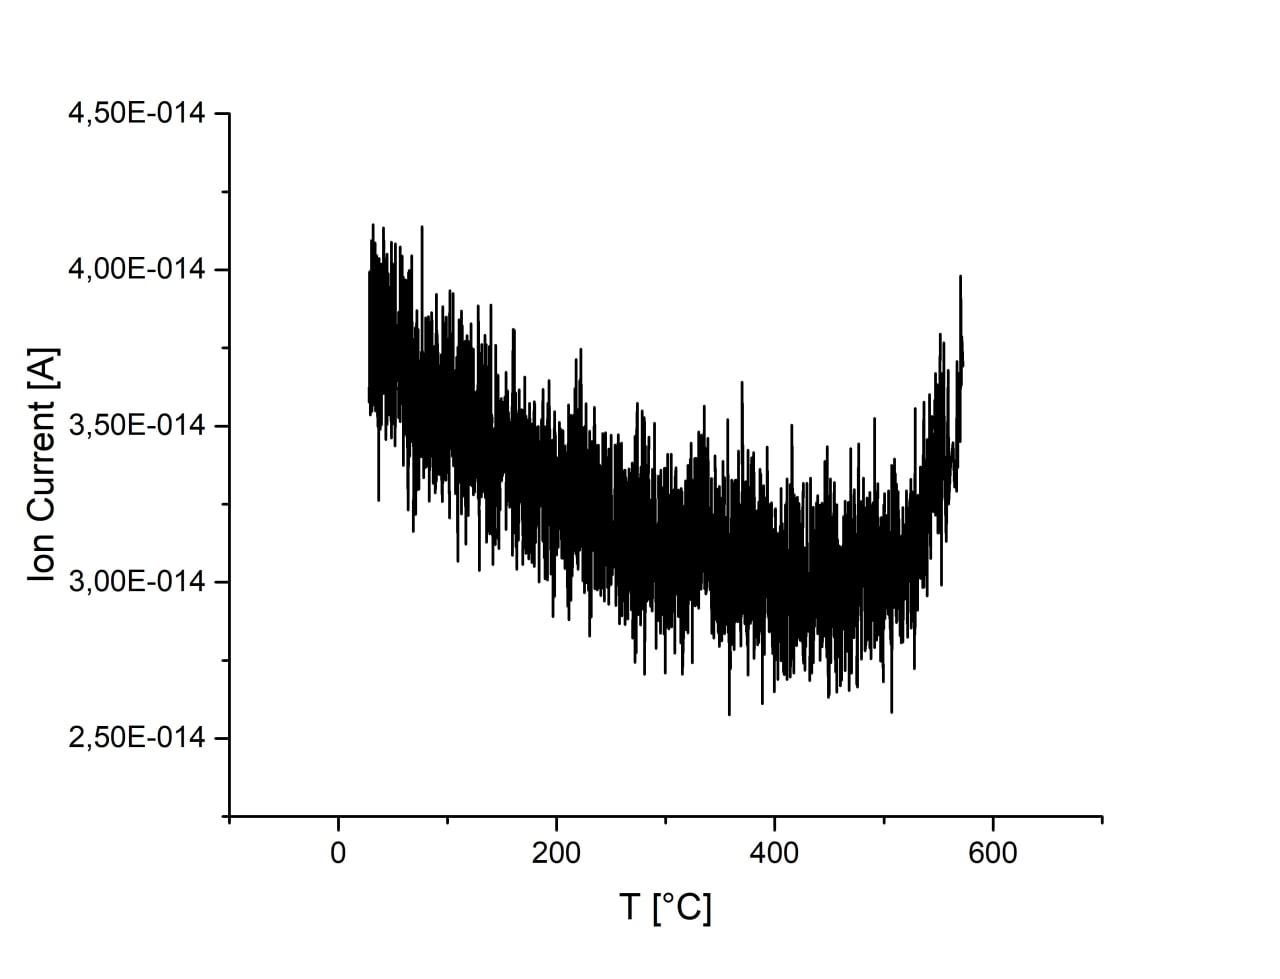
Pulse titration and TPD
Adsorption is almost unchanged with increase of ball-milling speed. There are no desorption peaks due to low CO2 content or strong bonding energy. Activation of sample in H2 atmosphere lead to the 1 order increase of CO2 adsorption. However, desorption is still not observed on this sample.
| sample |
ball-milling speed |
CO2 adsorption (H2 activated) |
|
r.p.m. |
μmol/g |
| dl100 |
450 |
0.071 |
| dl101 |
600 |
0.067 |
| dl102 |
750 |
0.080 (0.884) |
 |
 |
 |
| 450 r.p.m. |
600 r.p.m. |
750 r.p.m. |
 |
| 750 r.p.m., H2 activated |
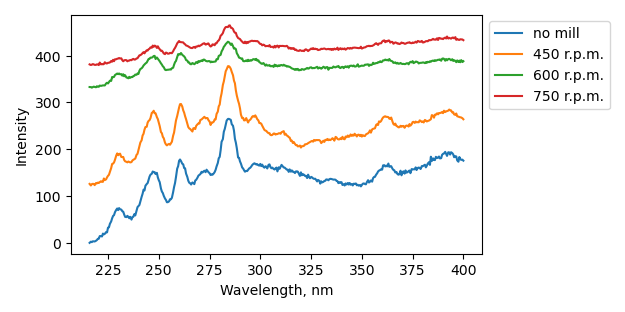
UV-vis and bandgap
Non-milled sample has 2 peaks at 217 and 250 nm which can be attributed to crystalline and defect BN bandgap absorptions [doi: 10.1038/s41598-019-47093-9]. Ball-milling leads firstly to disappearance of defect associated peak (dl100). Further increase of ball-milling speed leads to the appearance of peak at 241 nm and then its intensity increase as well as disappearance of higher energy peak.
 |
dl201: Plazmoterm μm powder after vacuum anneal at 1400°C for 4 hr
dl10[0-2]: dl201 ball-milled at 450, 600 and 750 r.p.m. |
Tauc's bandgap for direct transitions increases with increase of ball-milling speed from 5.09 to 5.5-5.66 eV. Bandgap for indirect transitions remains almost unchanged after increase of ball-milling speed. For sample ball-milled at 450 r.p.m. direct and indirect bandgaps almost equal each other. After increase of ball-milling speed difference between direct-indirect transitions increases with direct bandgap higher in energy.

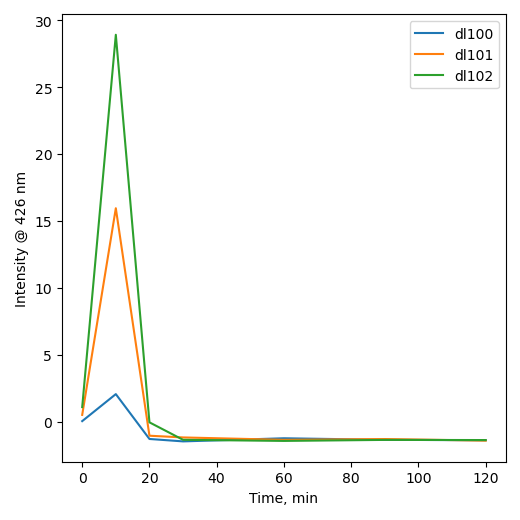
Photoluminescence
Ball milling results in decrease of pl intensity of BN with increase of treatment speed.
BET
Specific surface area increases after ball-milling at 450 r.p.m. and sharply decreases after increase of ball-milling speed.
| sample |
ball-milling speed |
Ssp |
|
r.p.m. |
m2/g |
| dl100 |
450 |
129.3 |
| dl101 |
600 |
6.4 |
| dl102 |
750 |
6.7 |
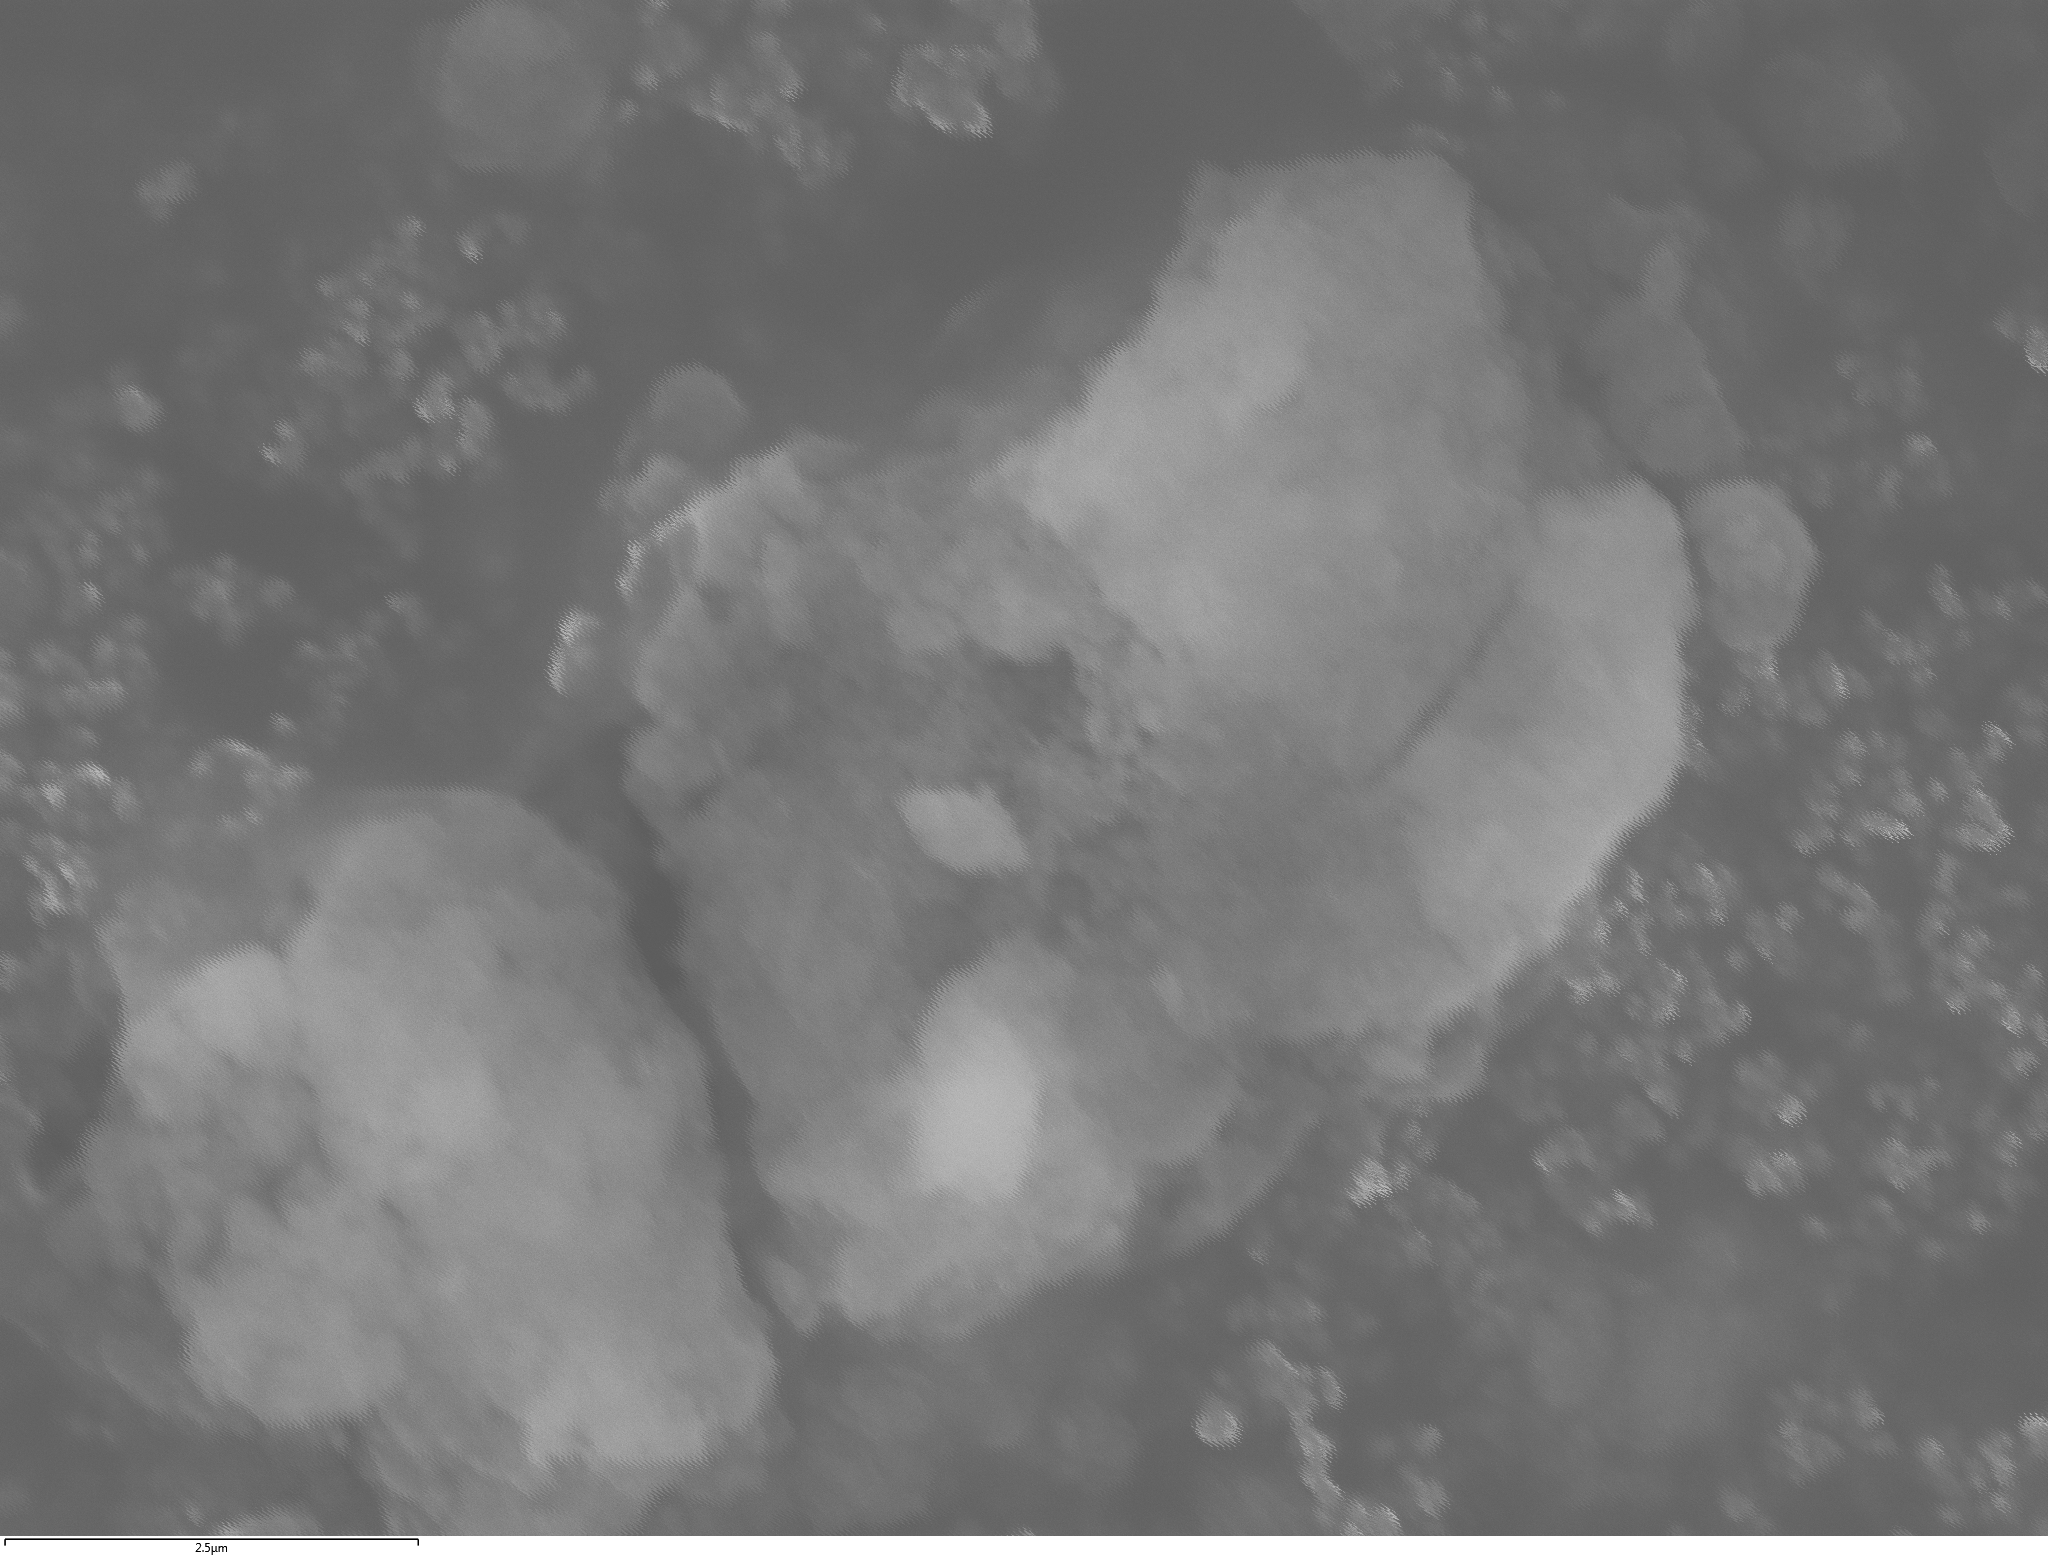
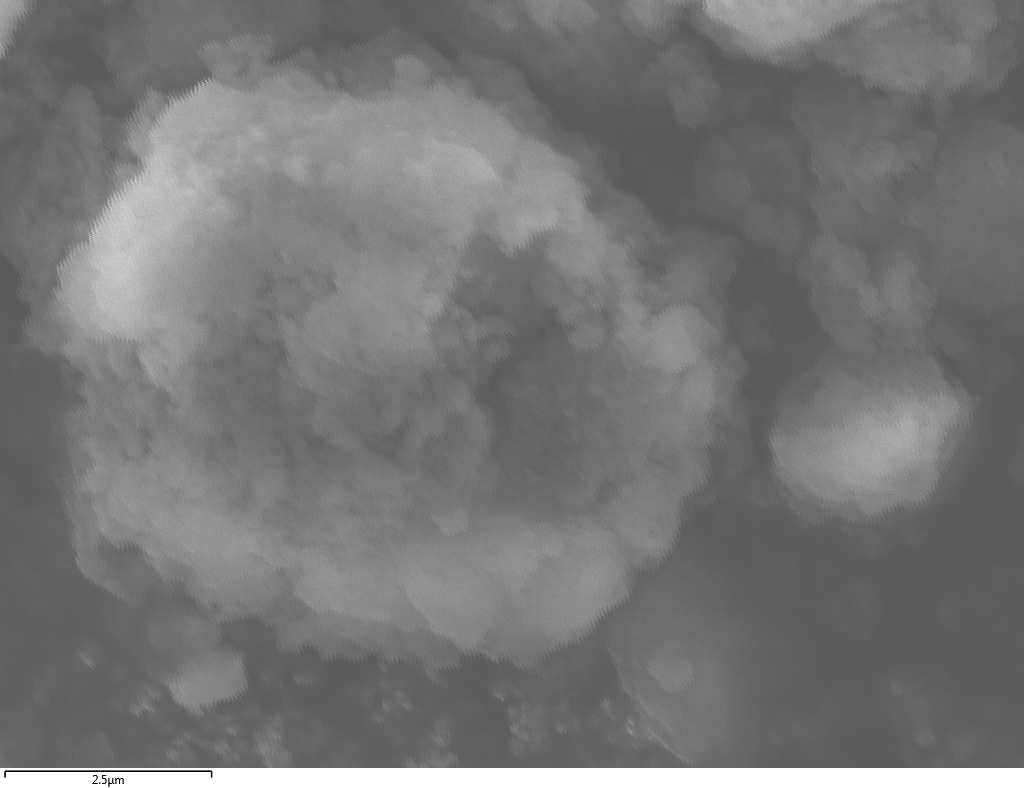
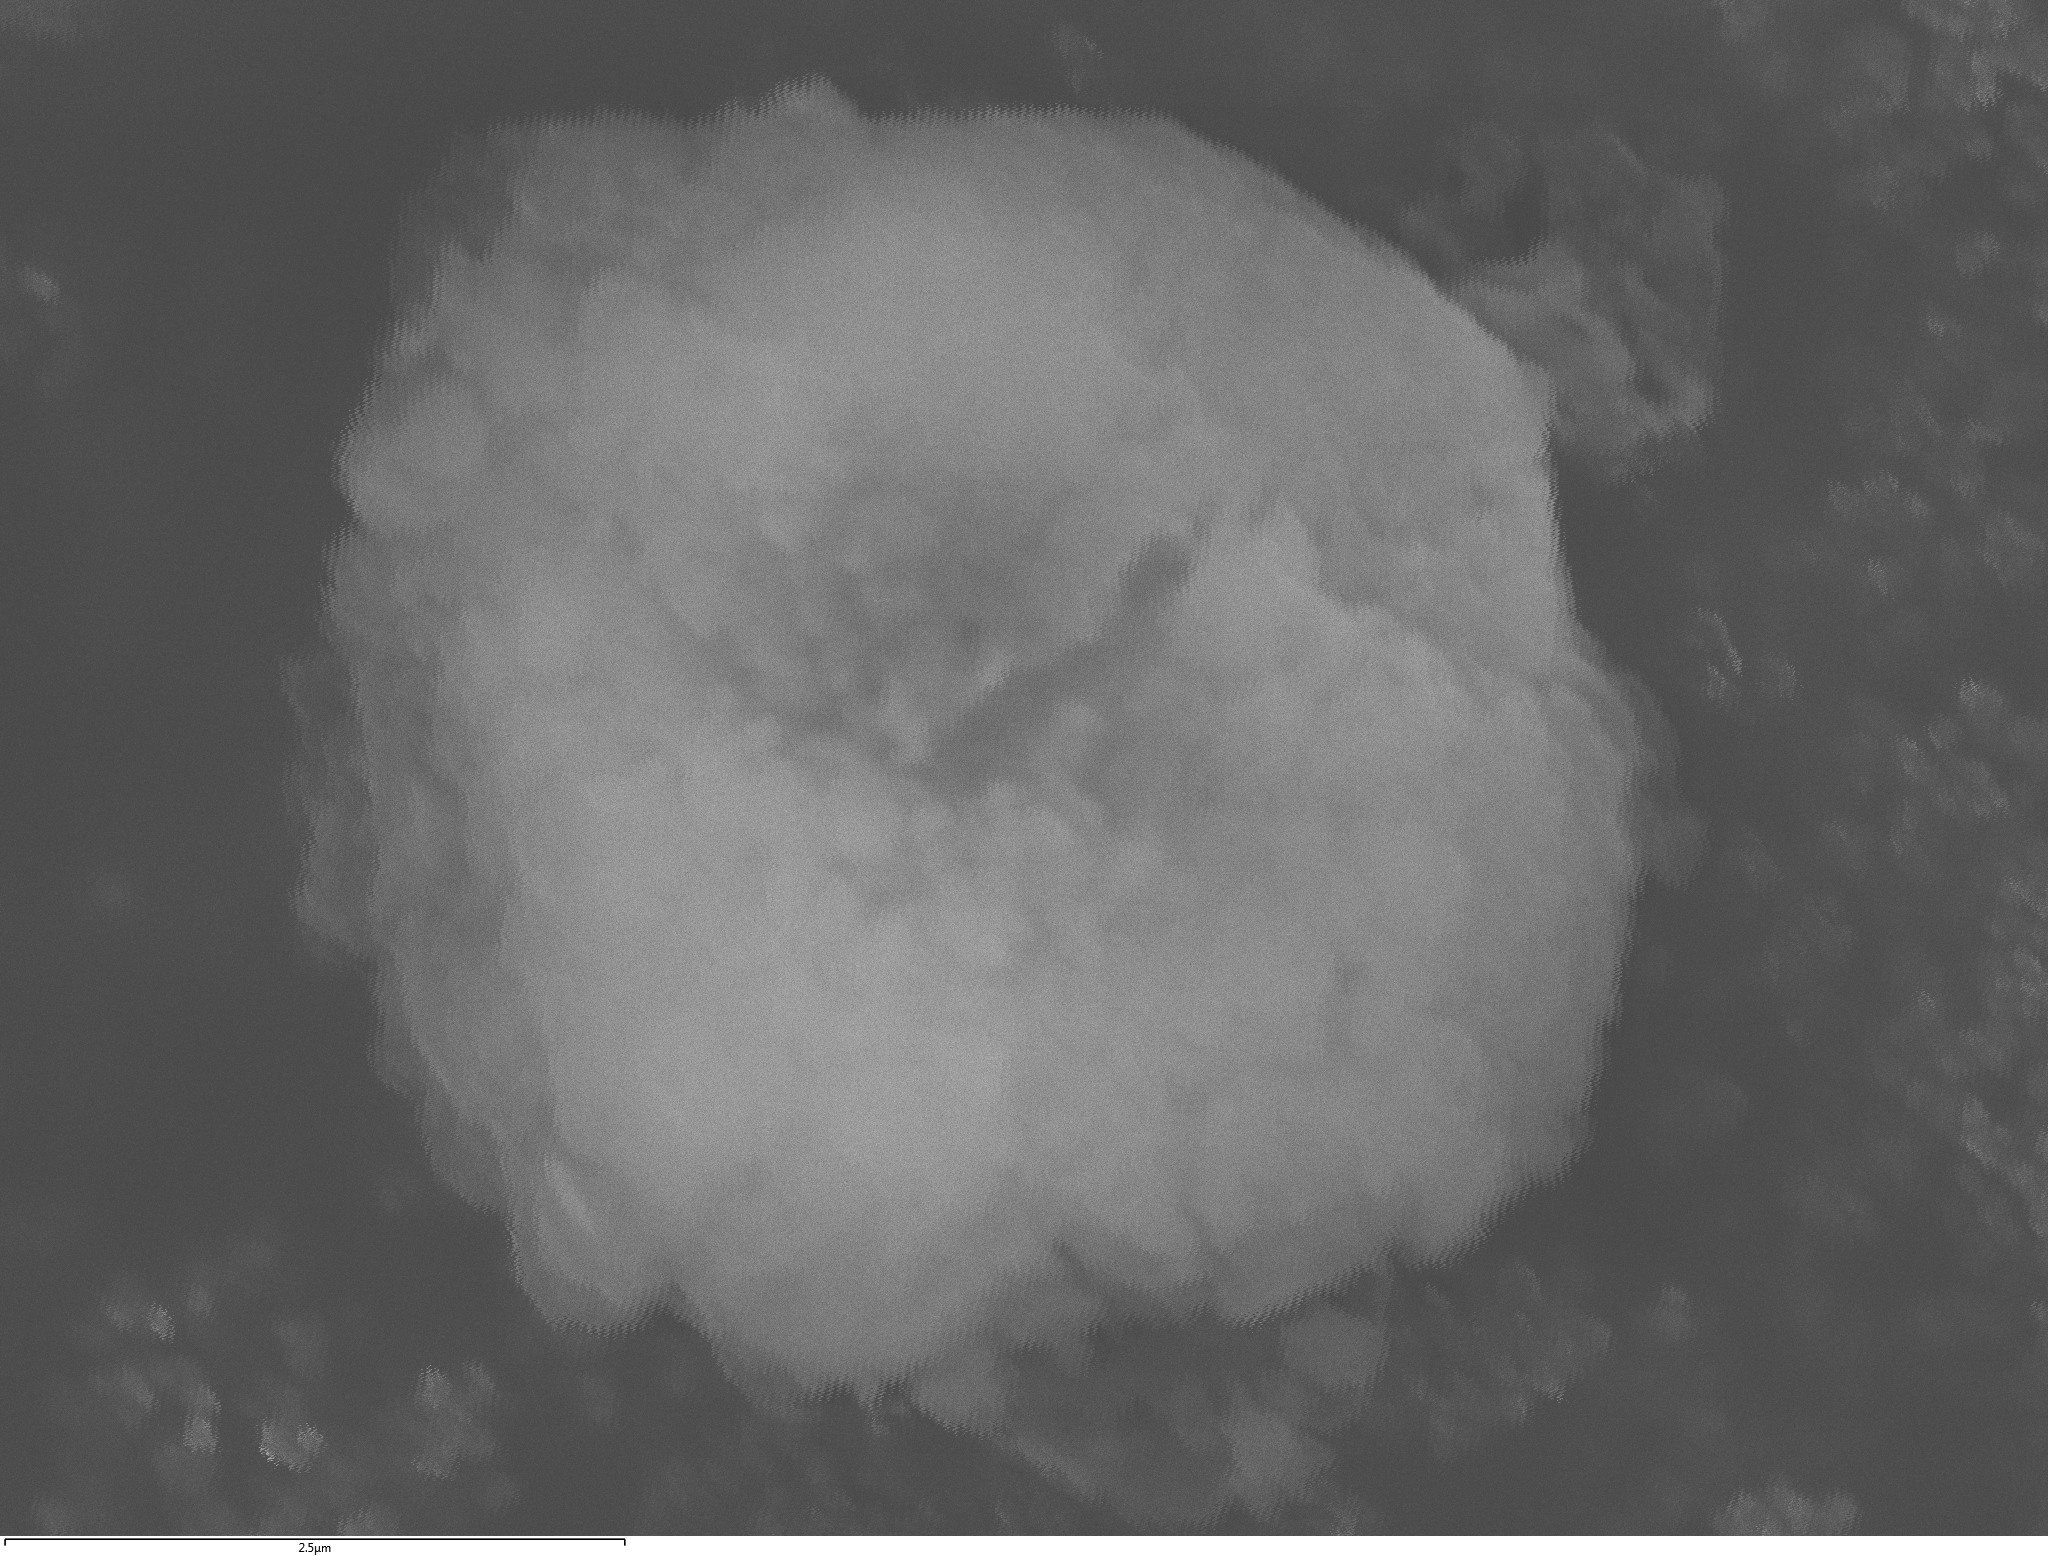
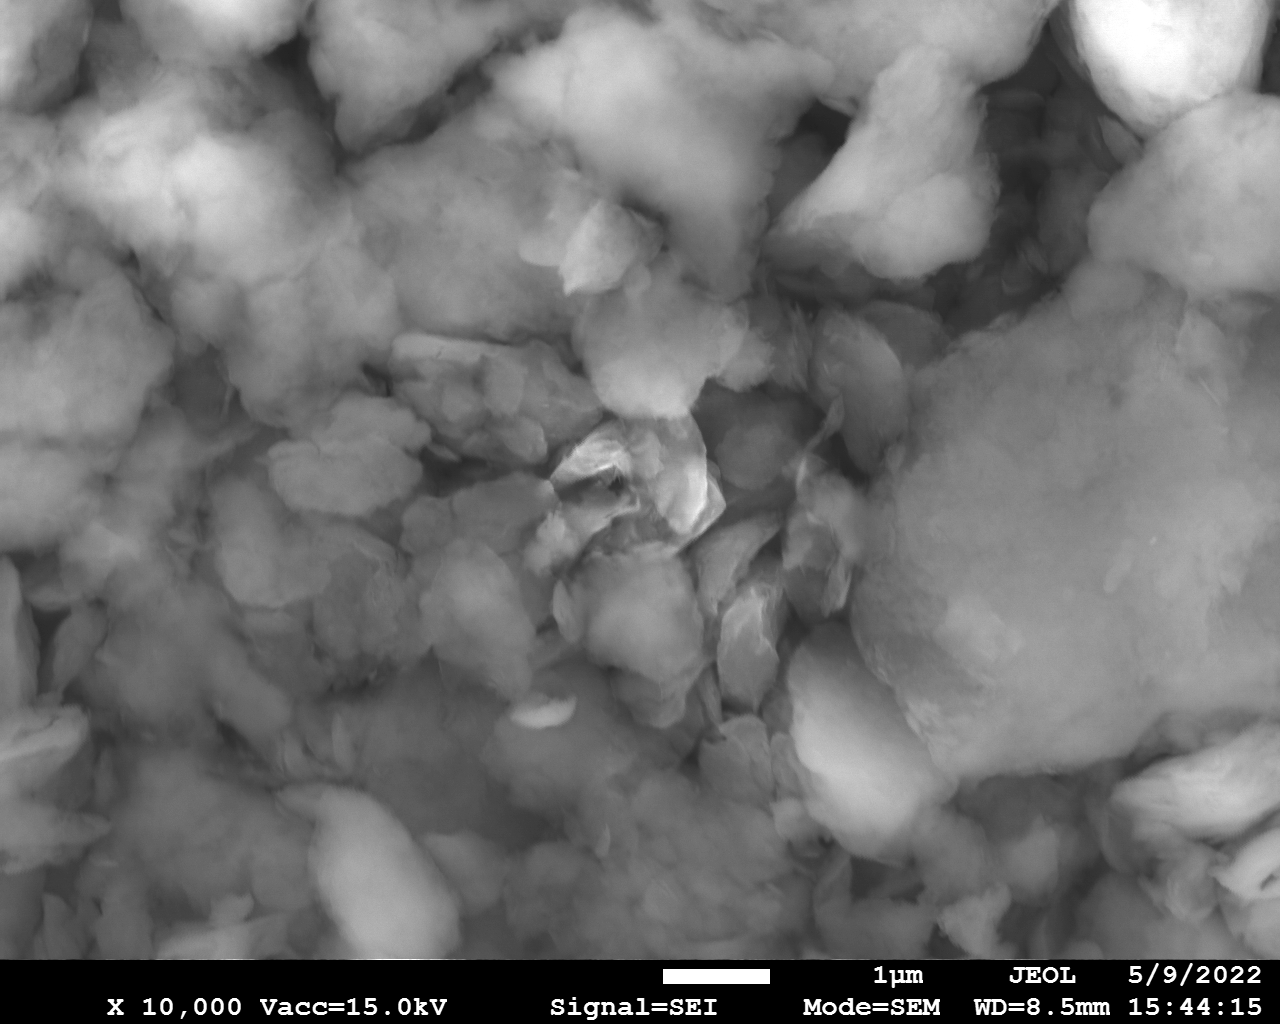
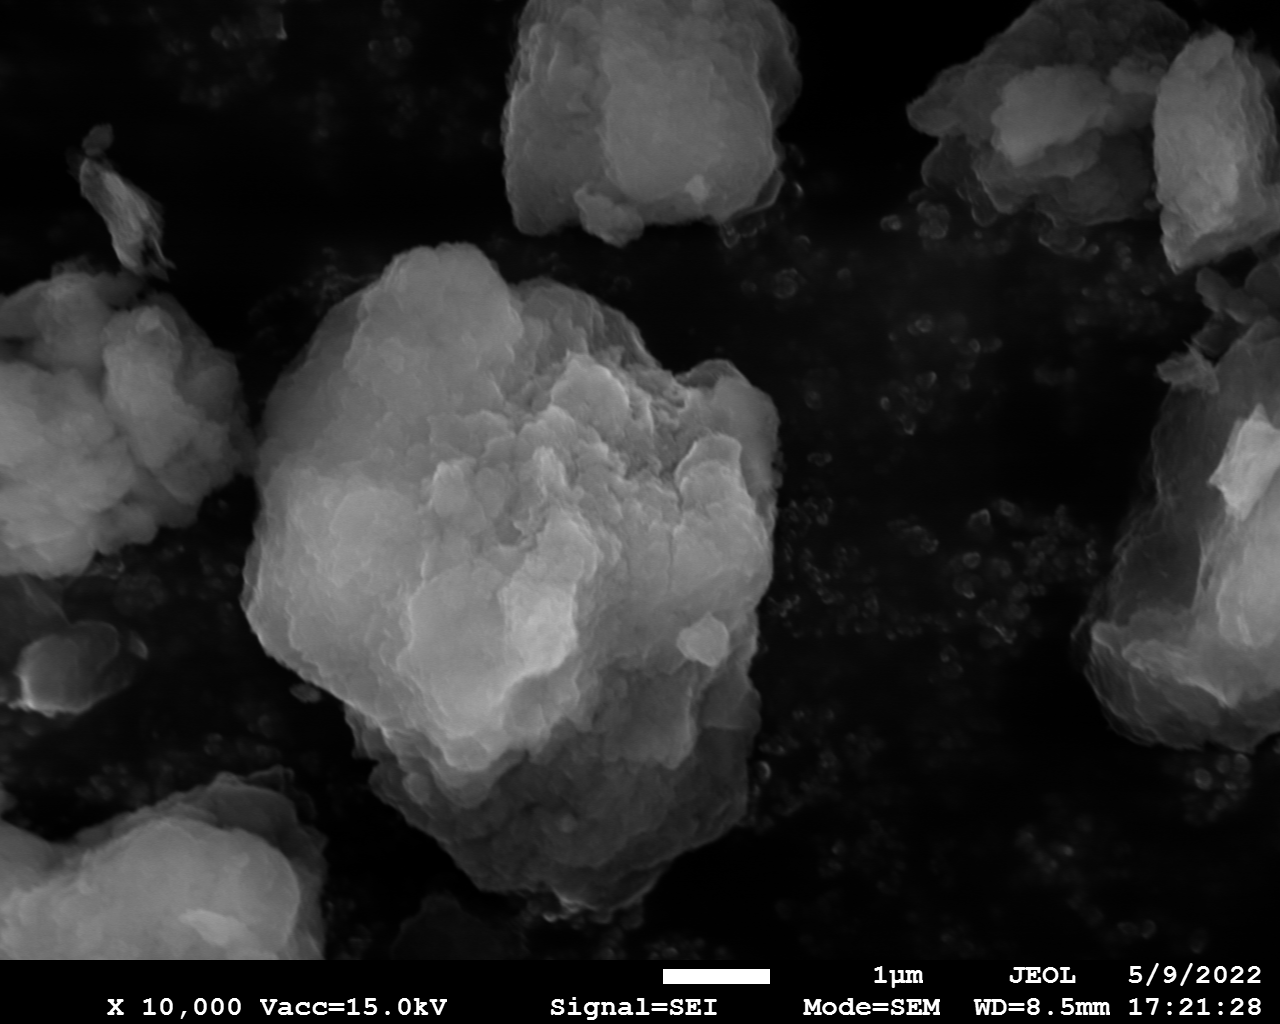
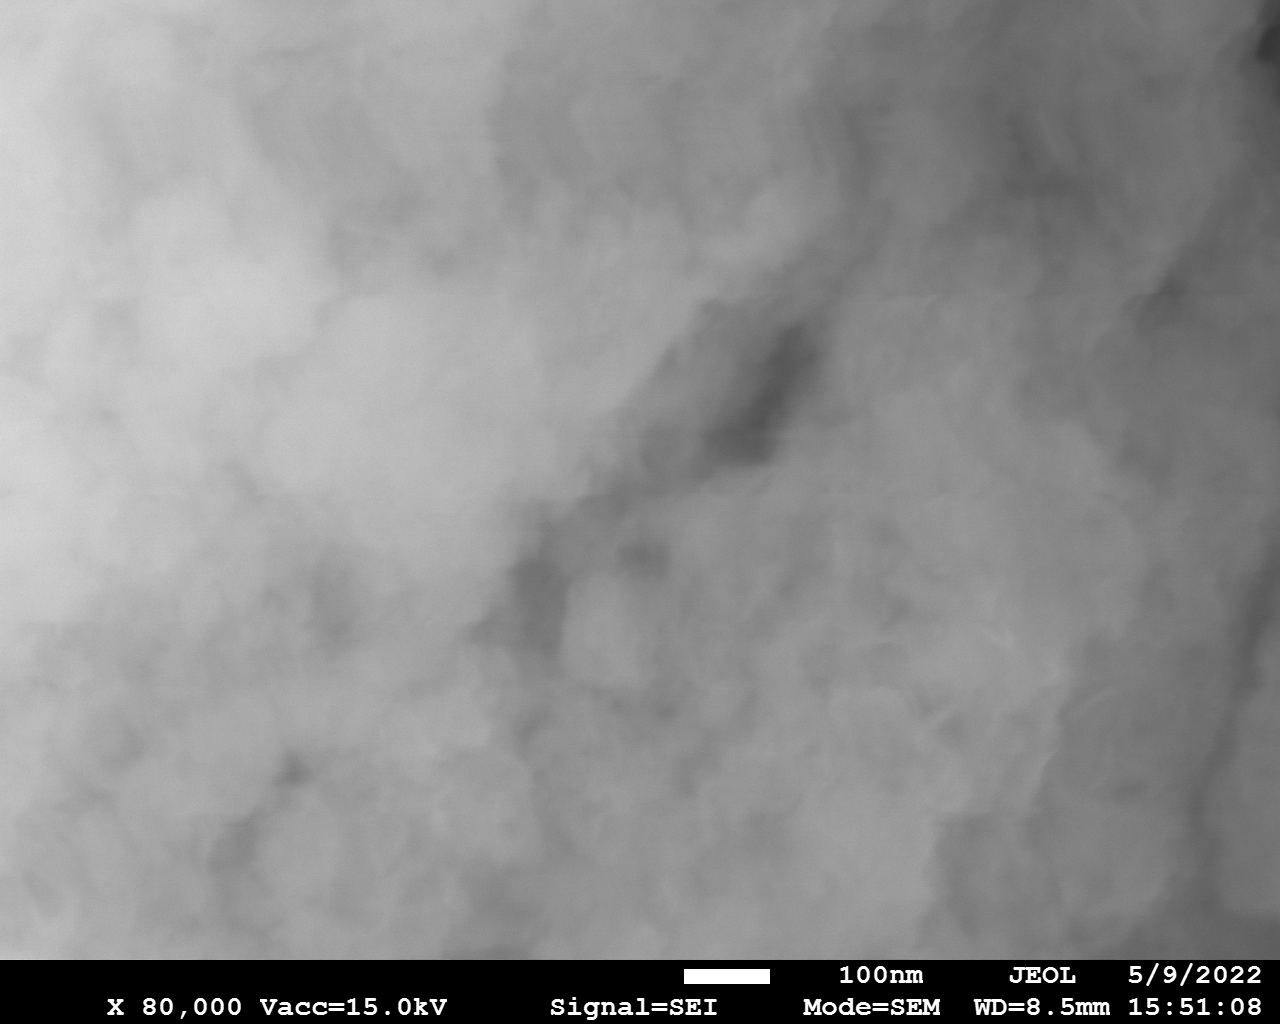
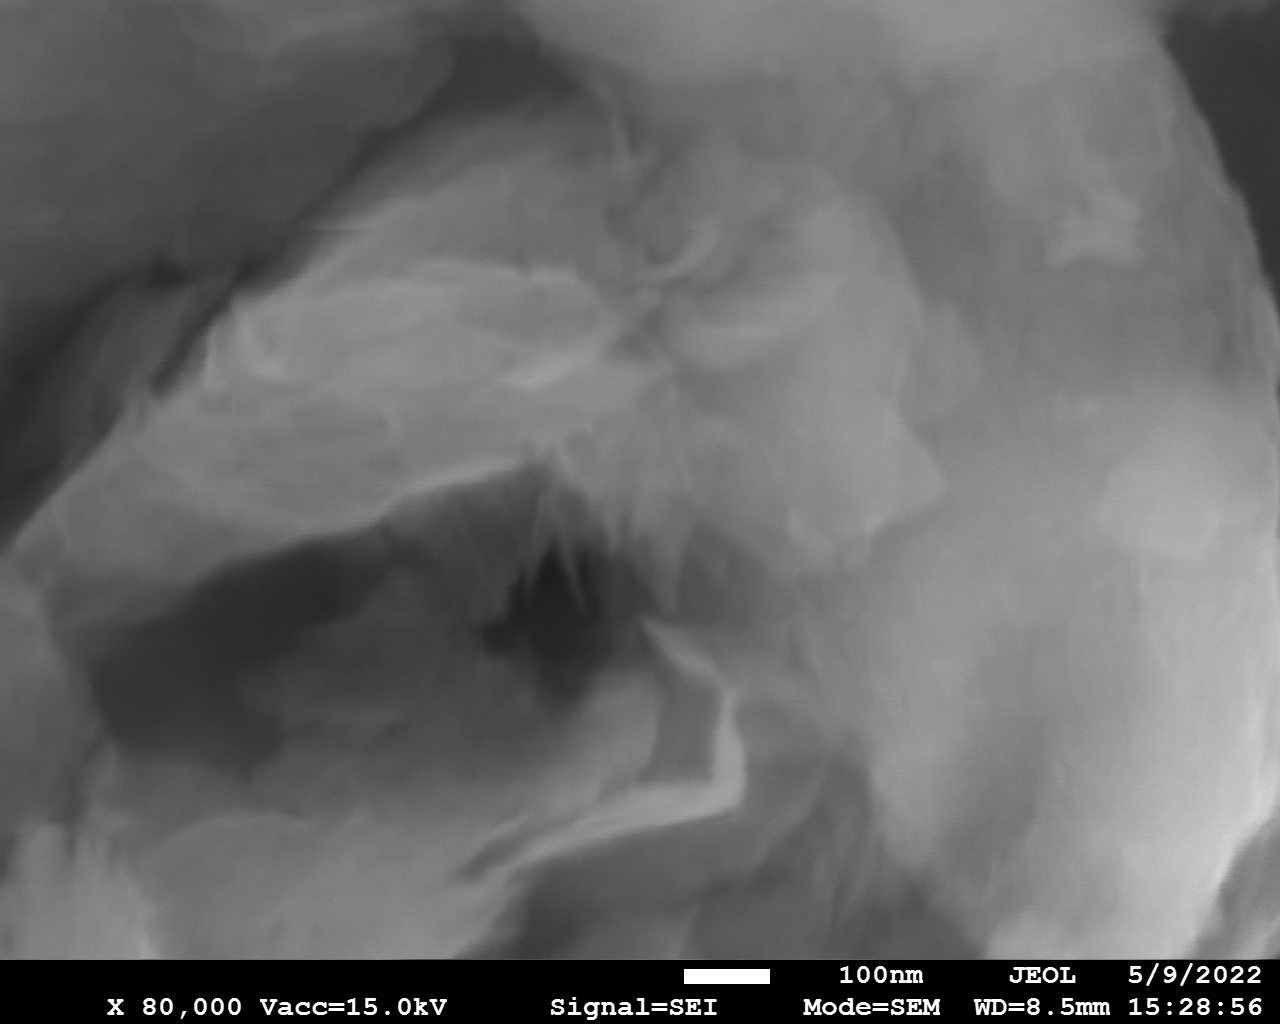
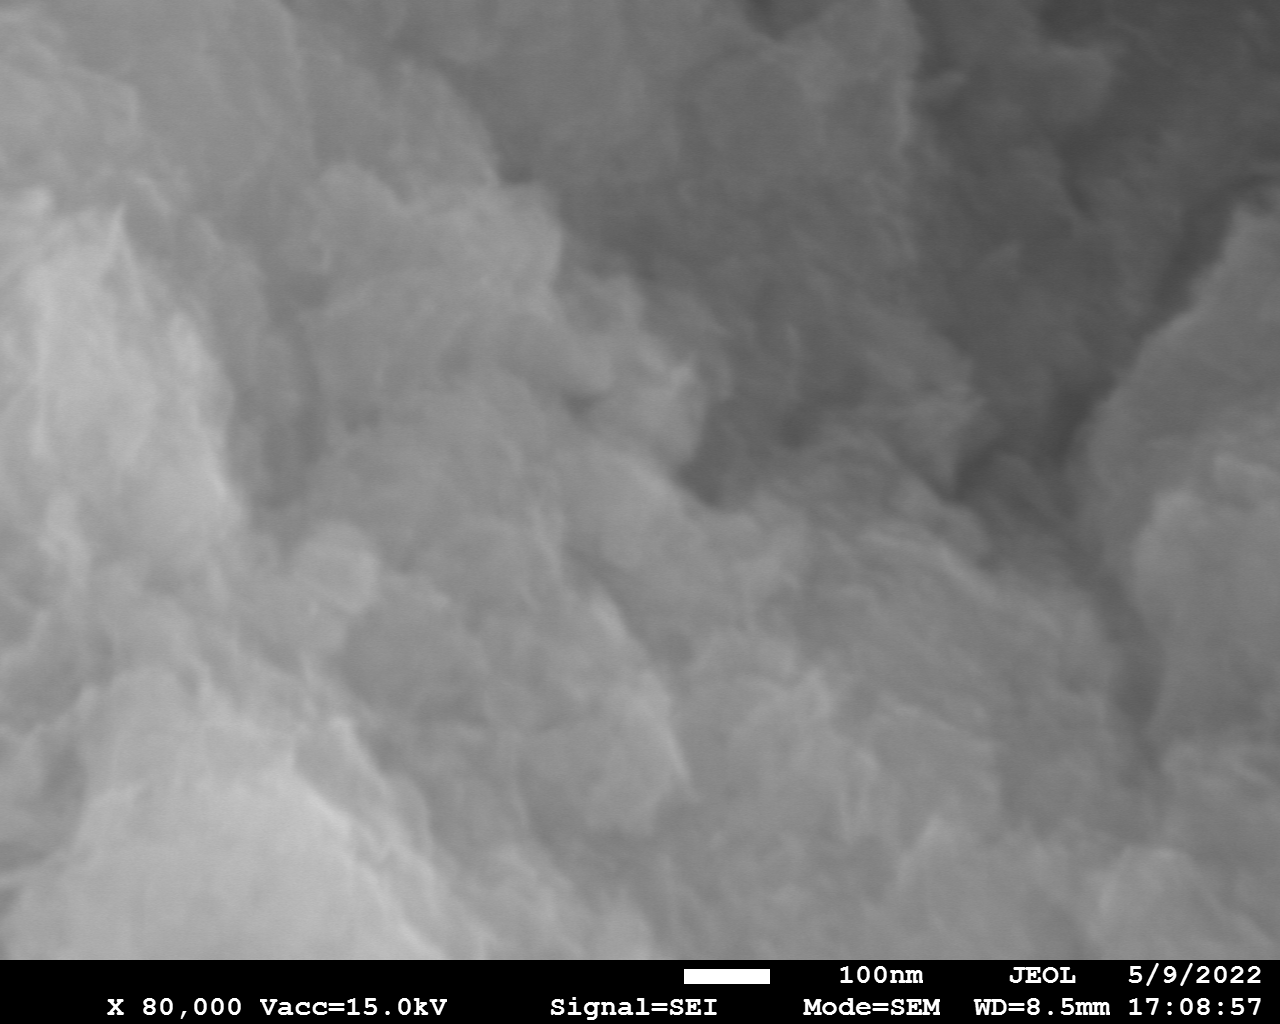
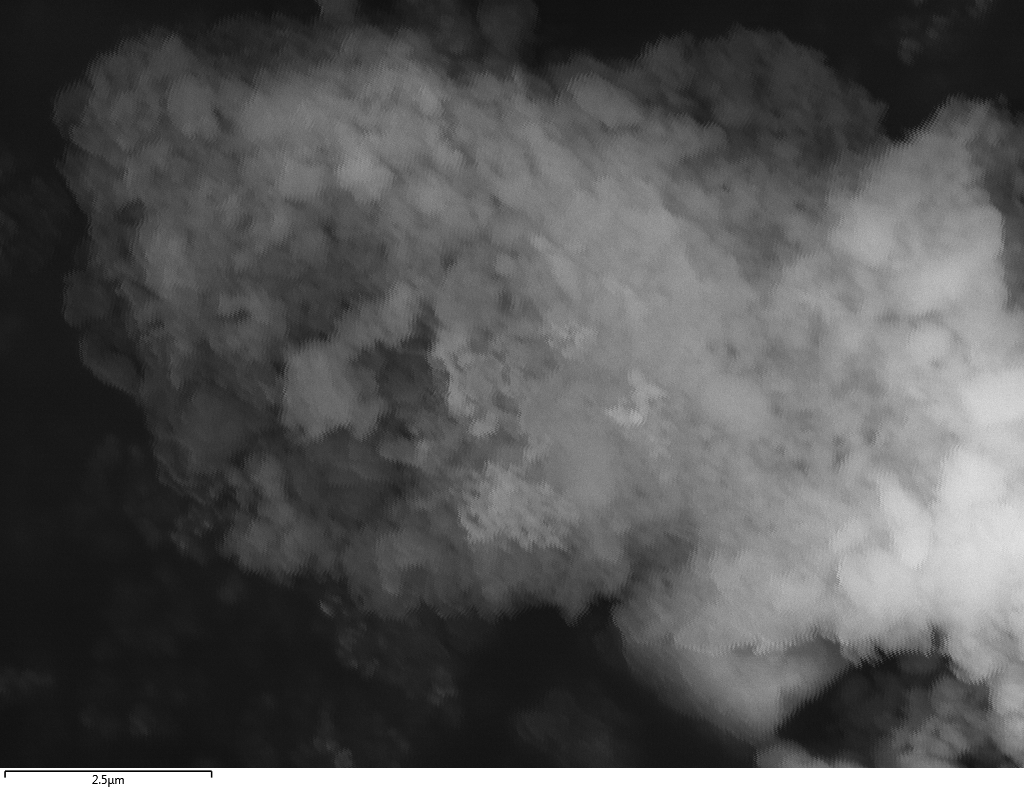
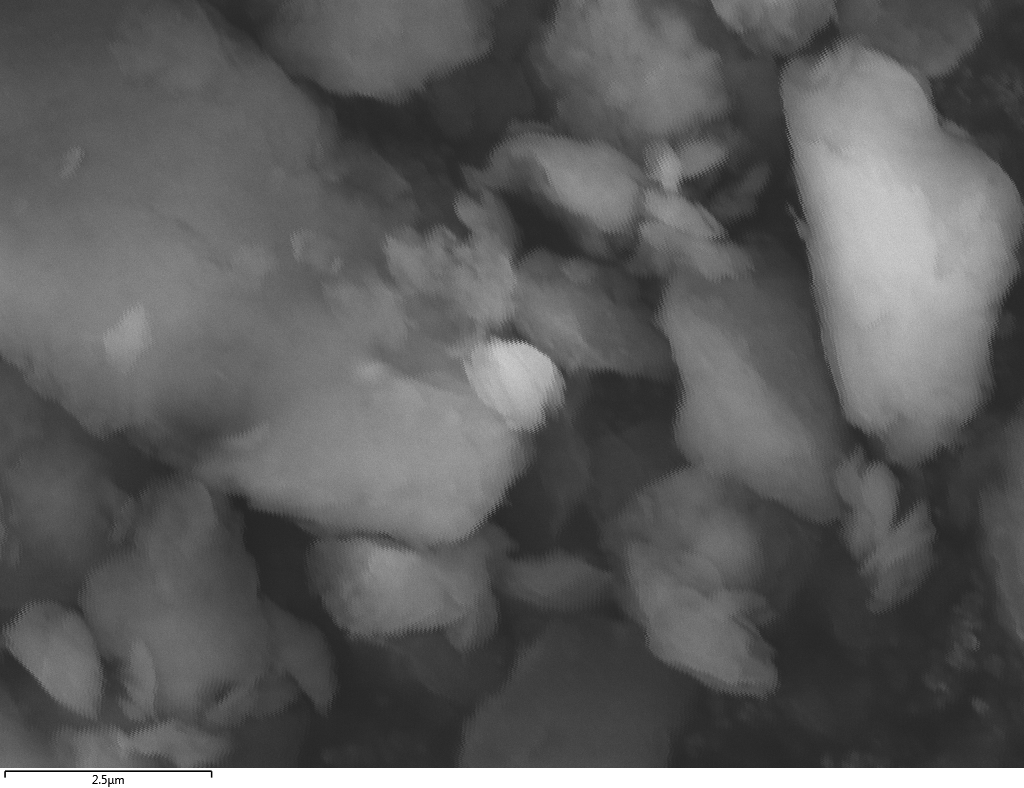
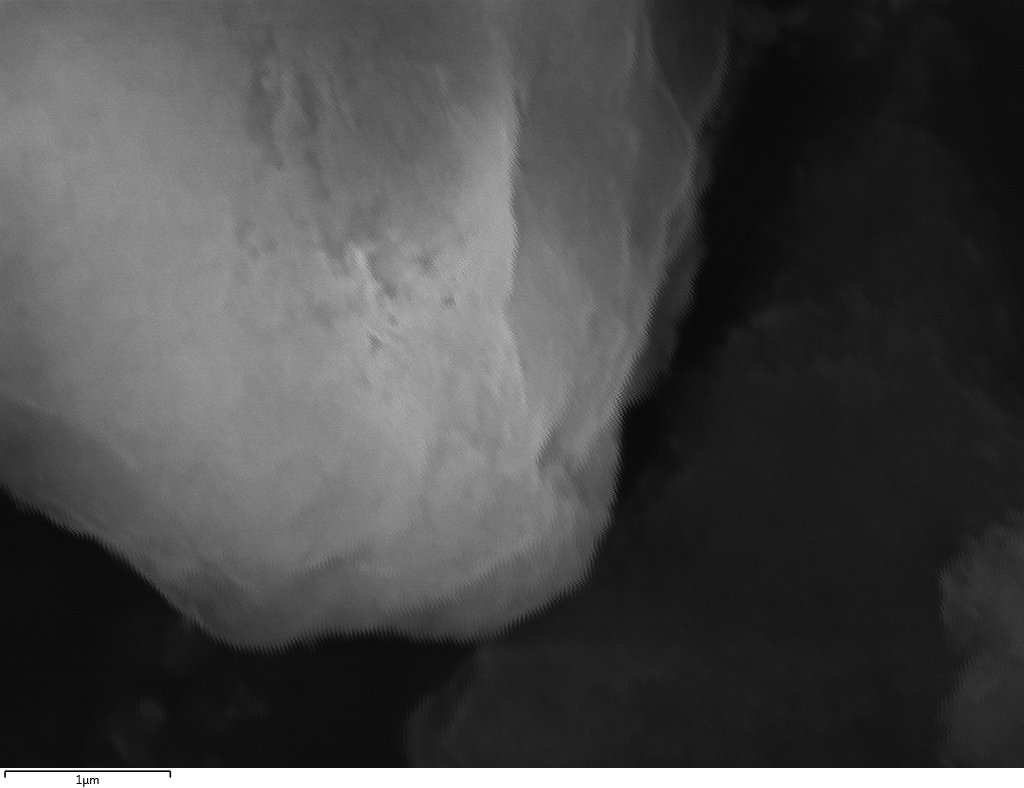
SEM and EDX
Samples consist of irregular shaped particles. After the increase of ball-milling speed particles' sizes increases at 600 r.p.m. and then decreases at 750 r.p.m. Sample ball-milled at 450 contains plate-shaped particles probably remained from initial BN sample.


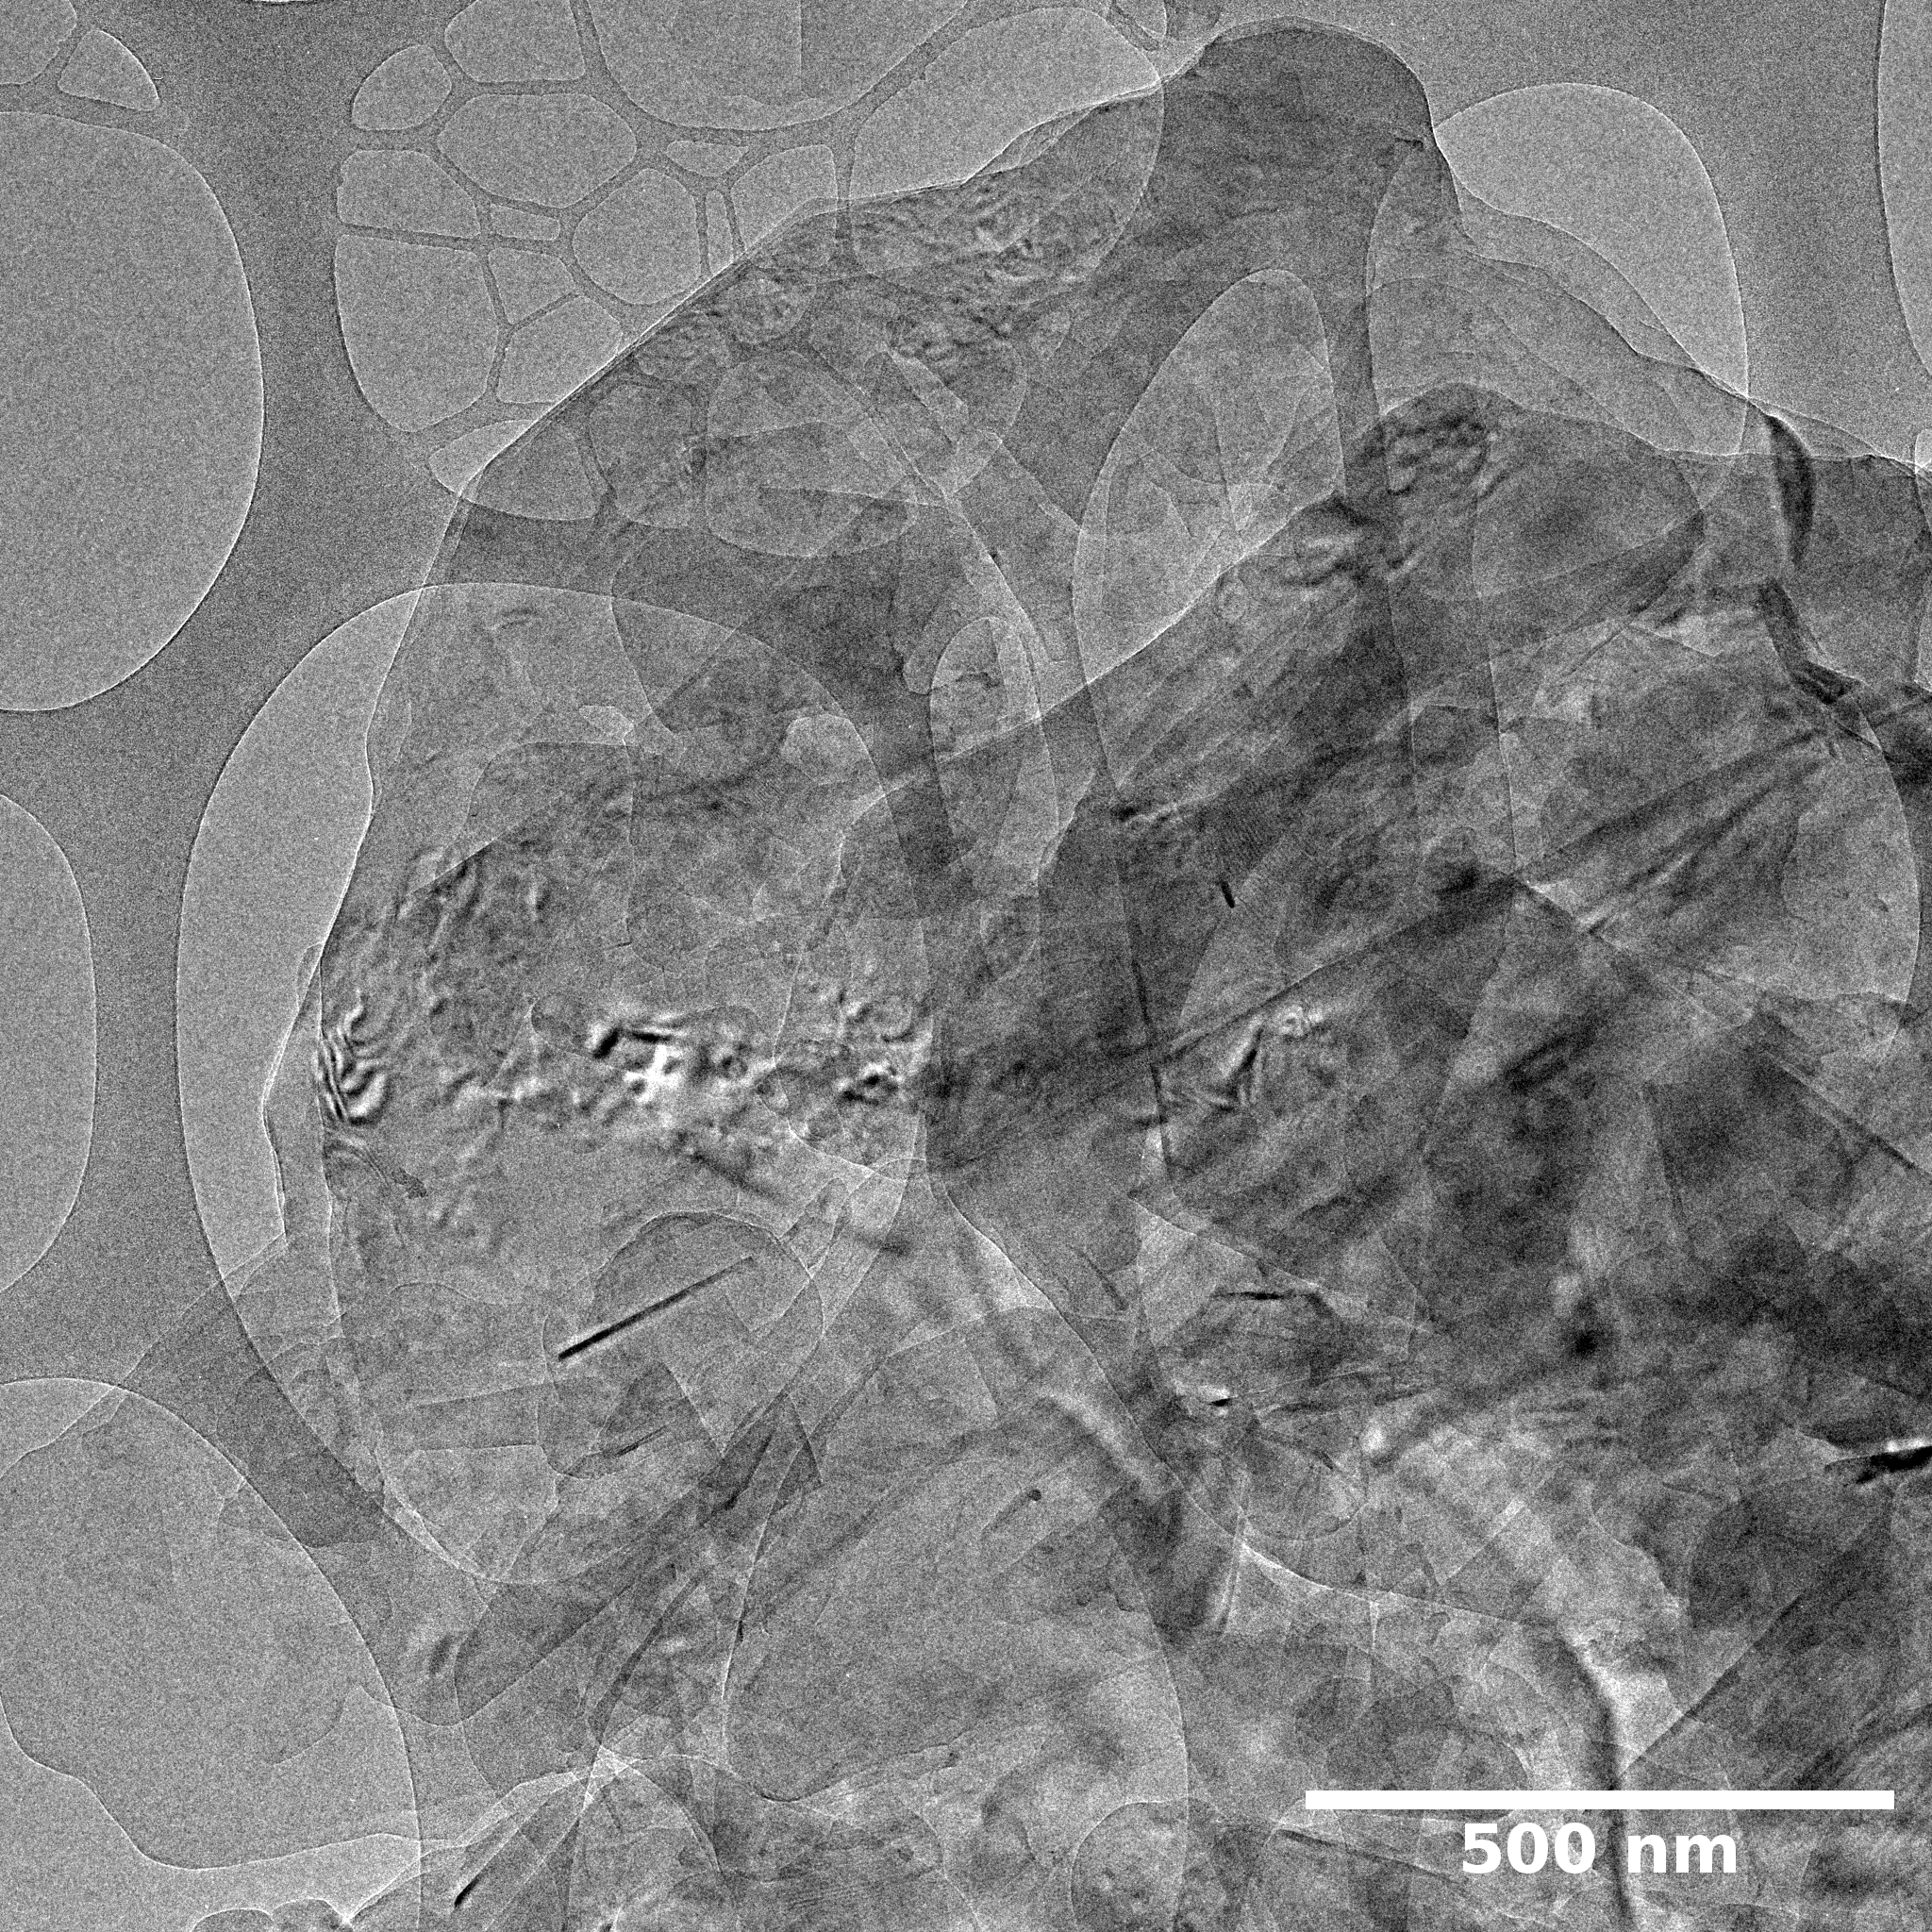
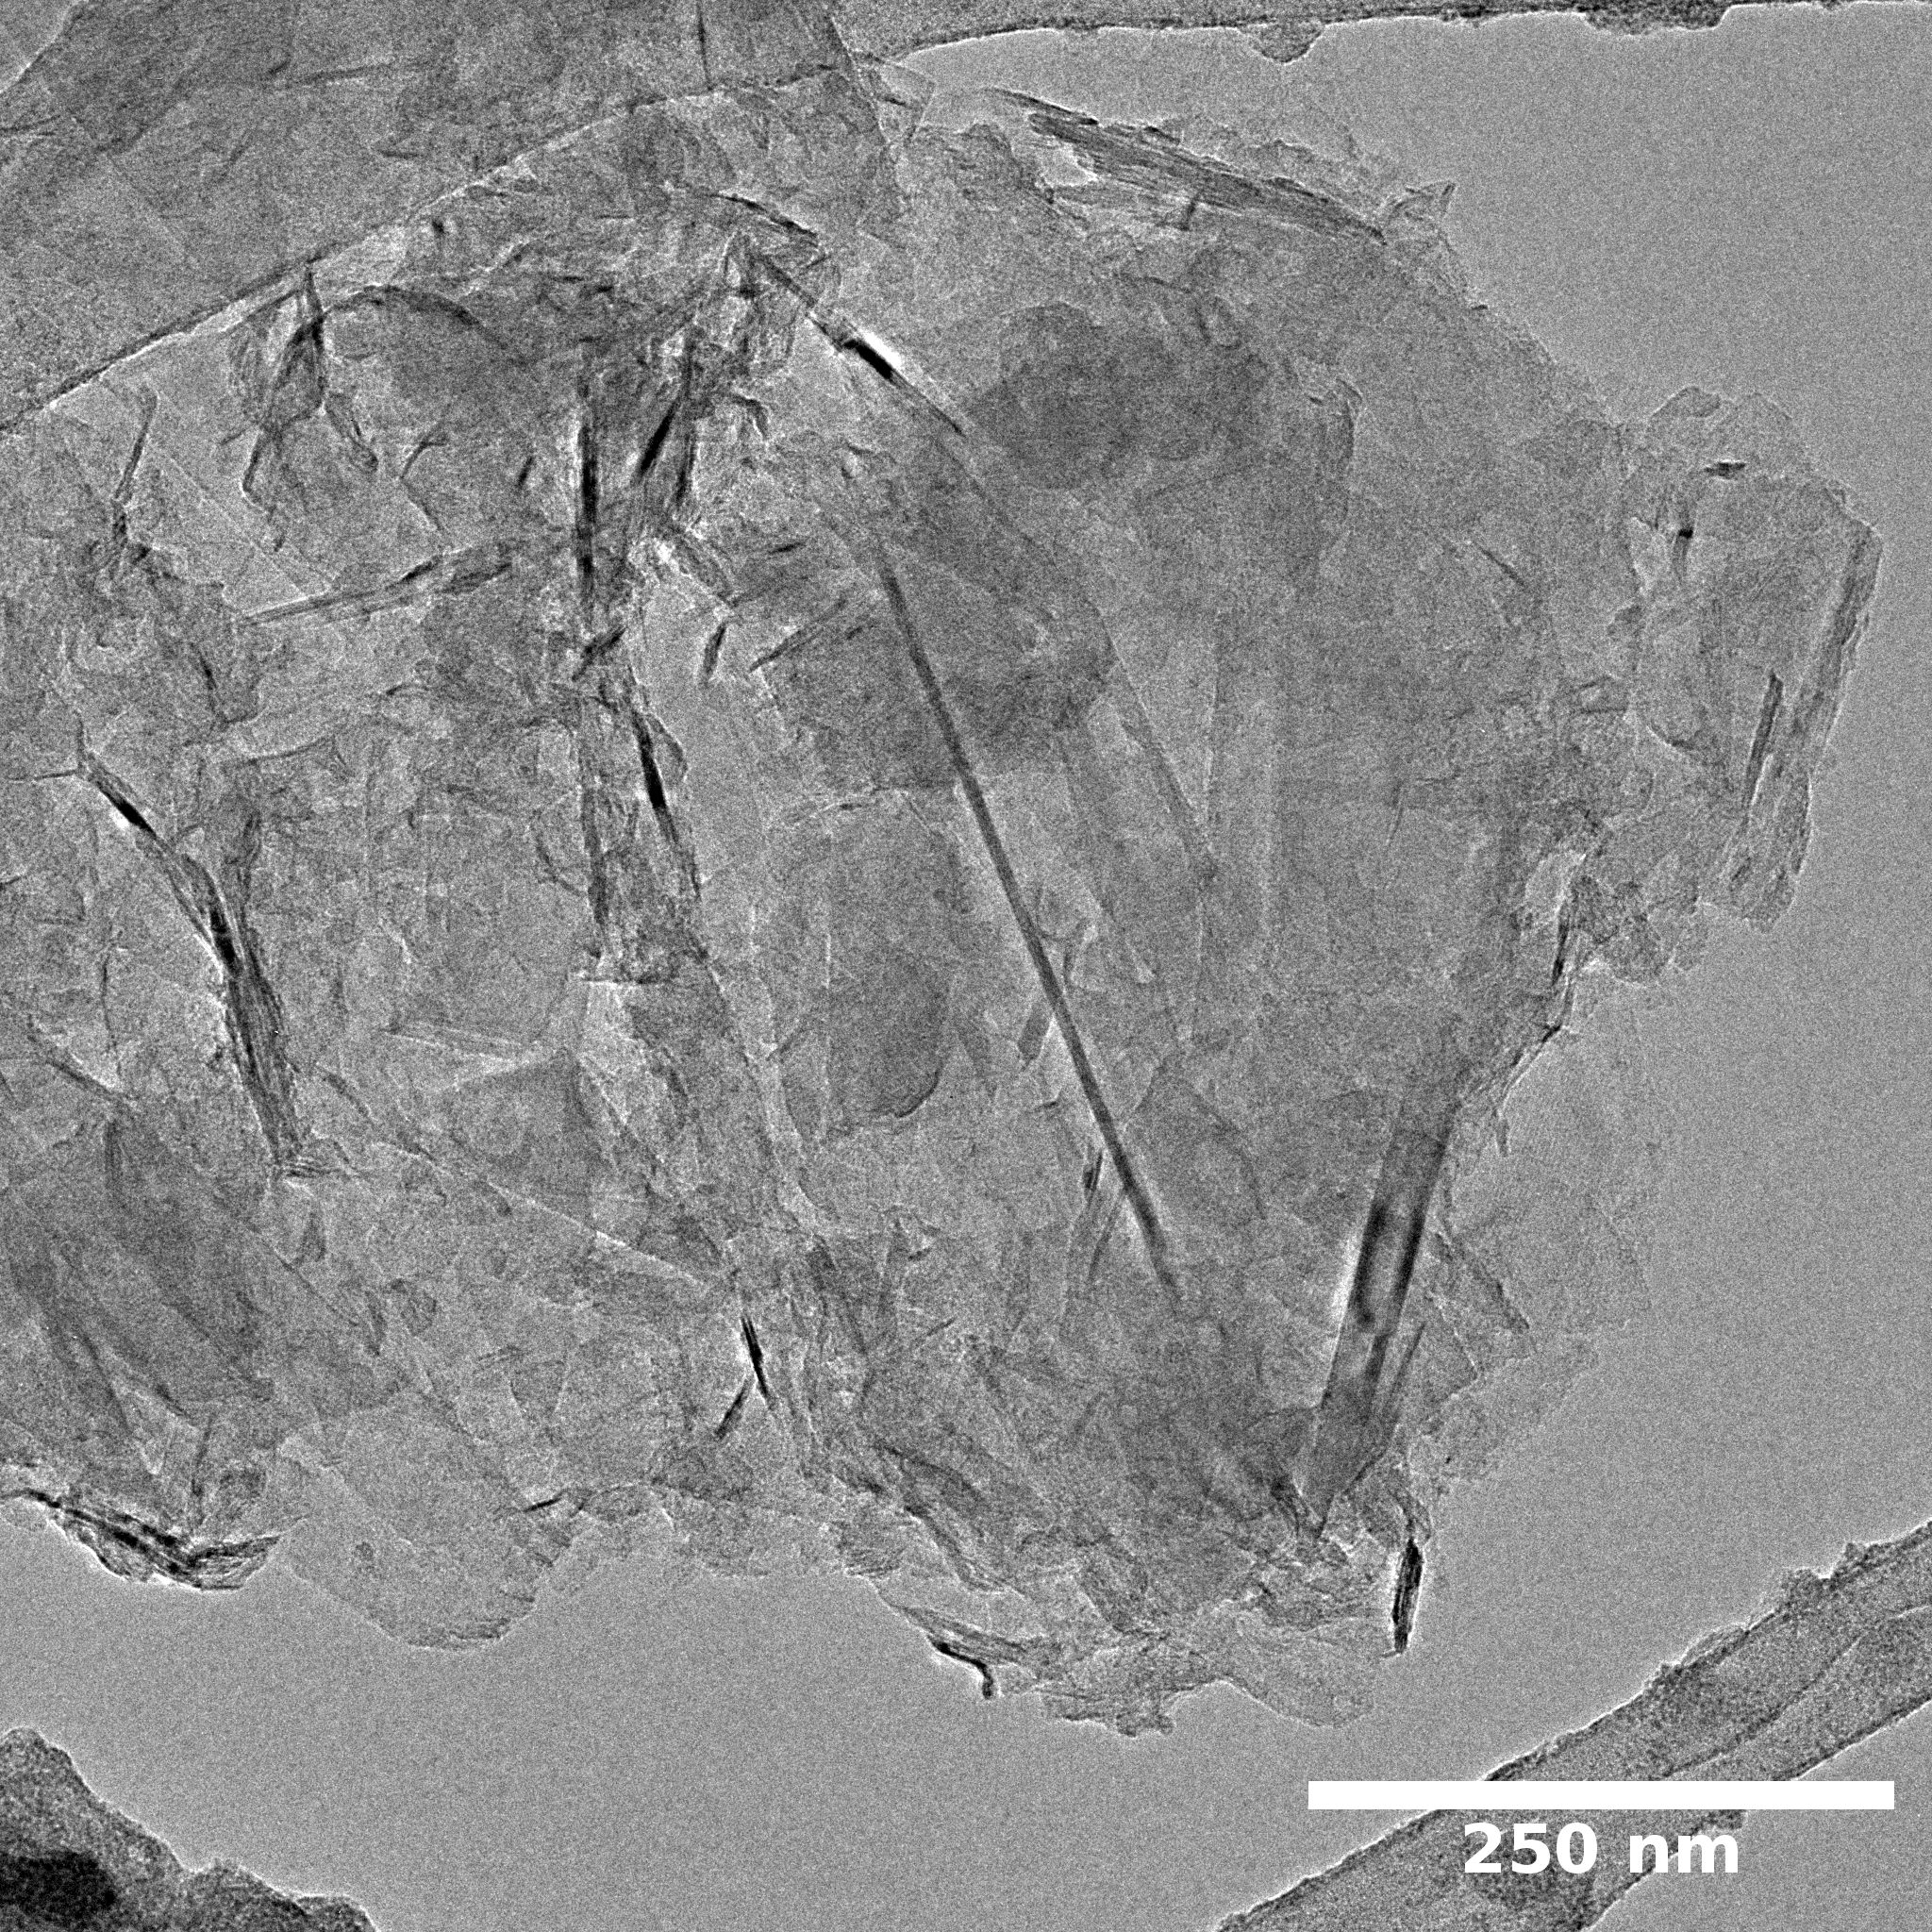
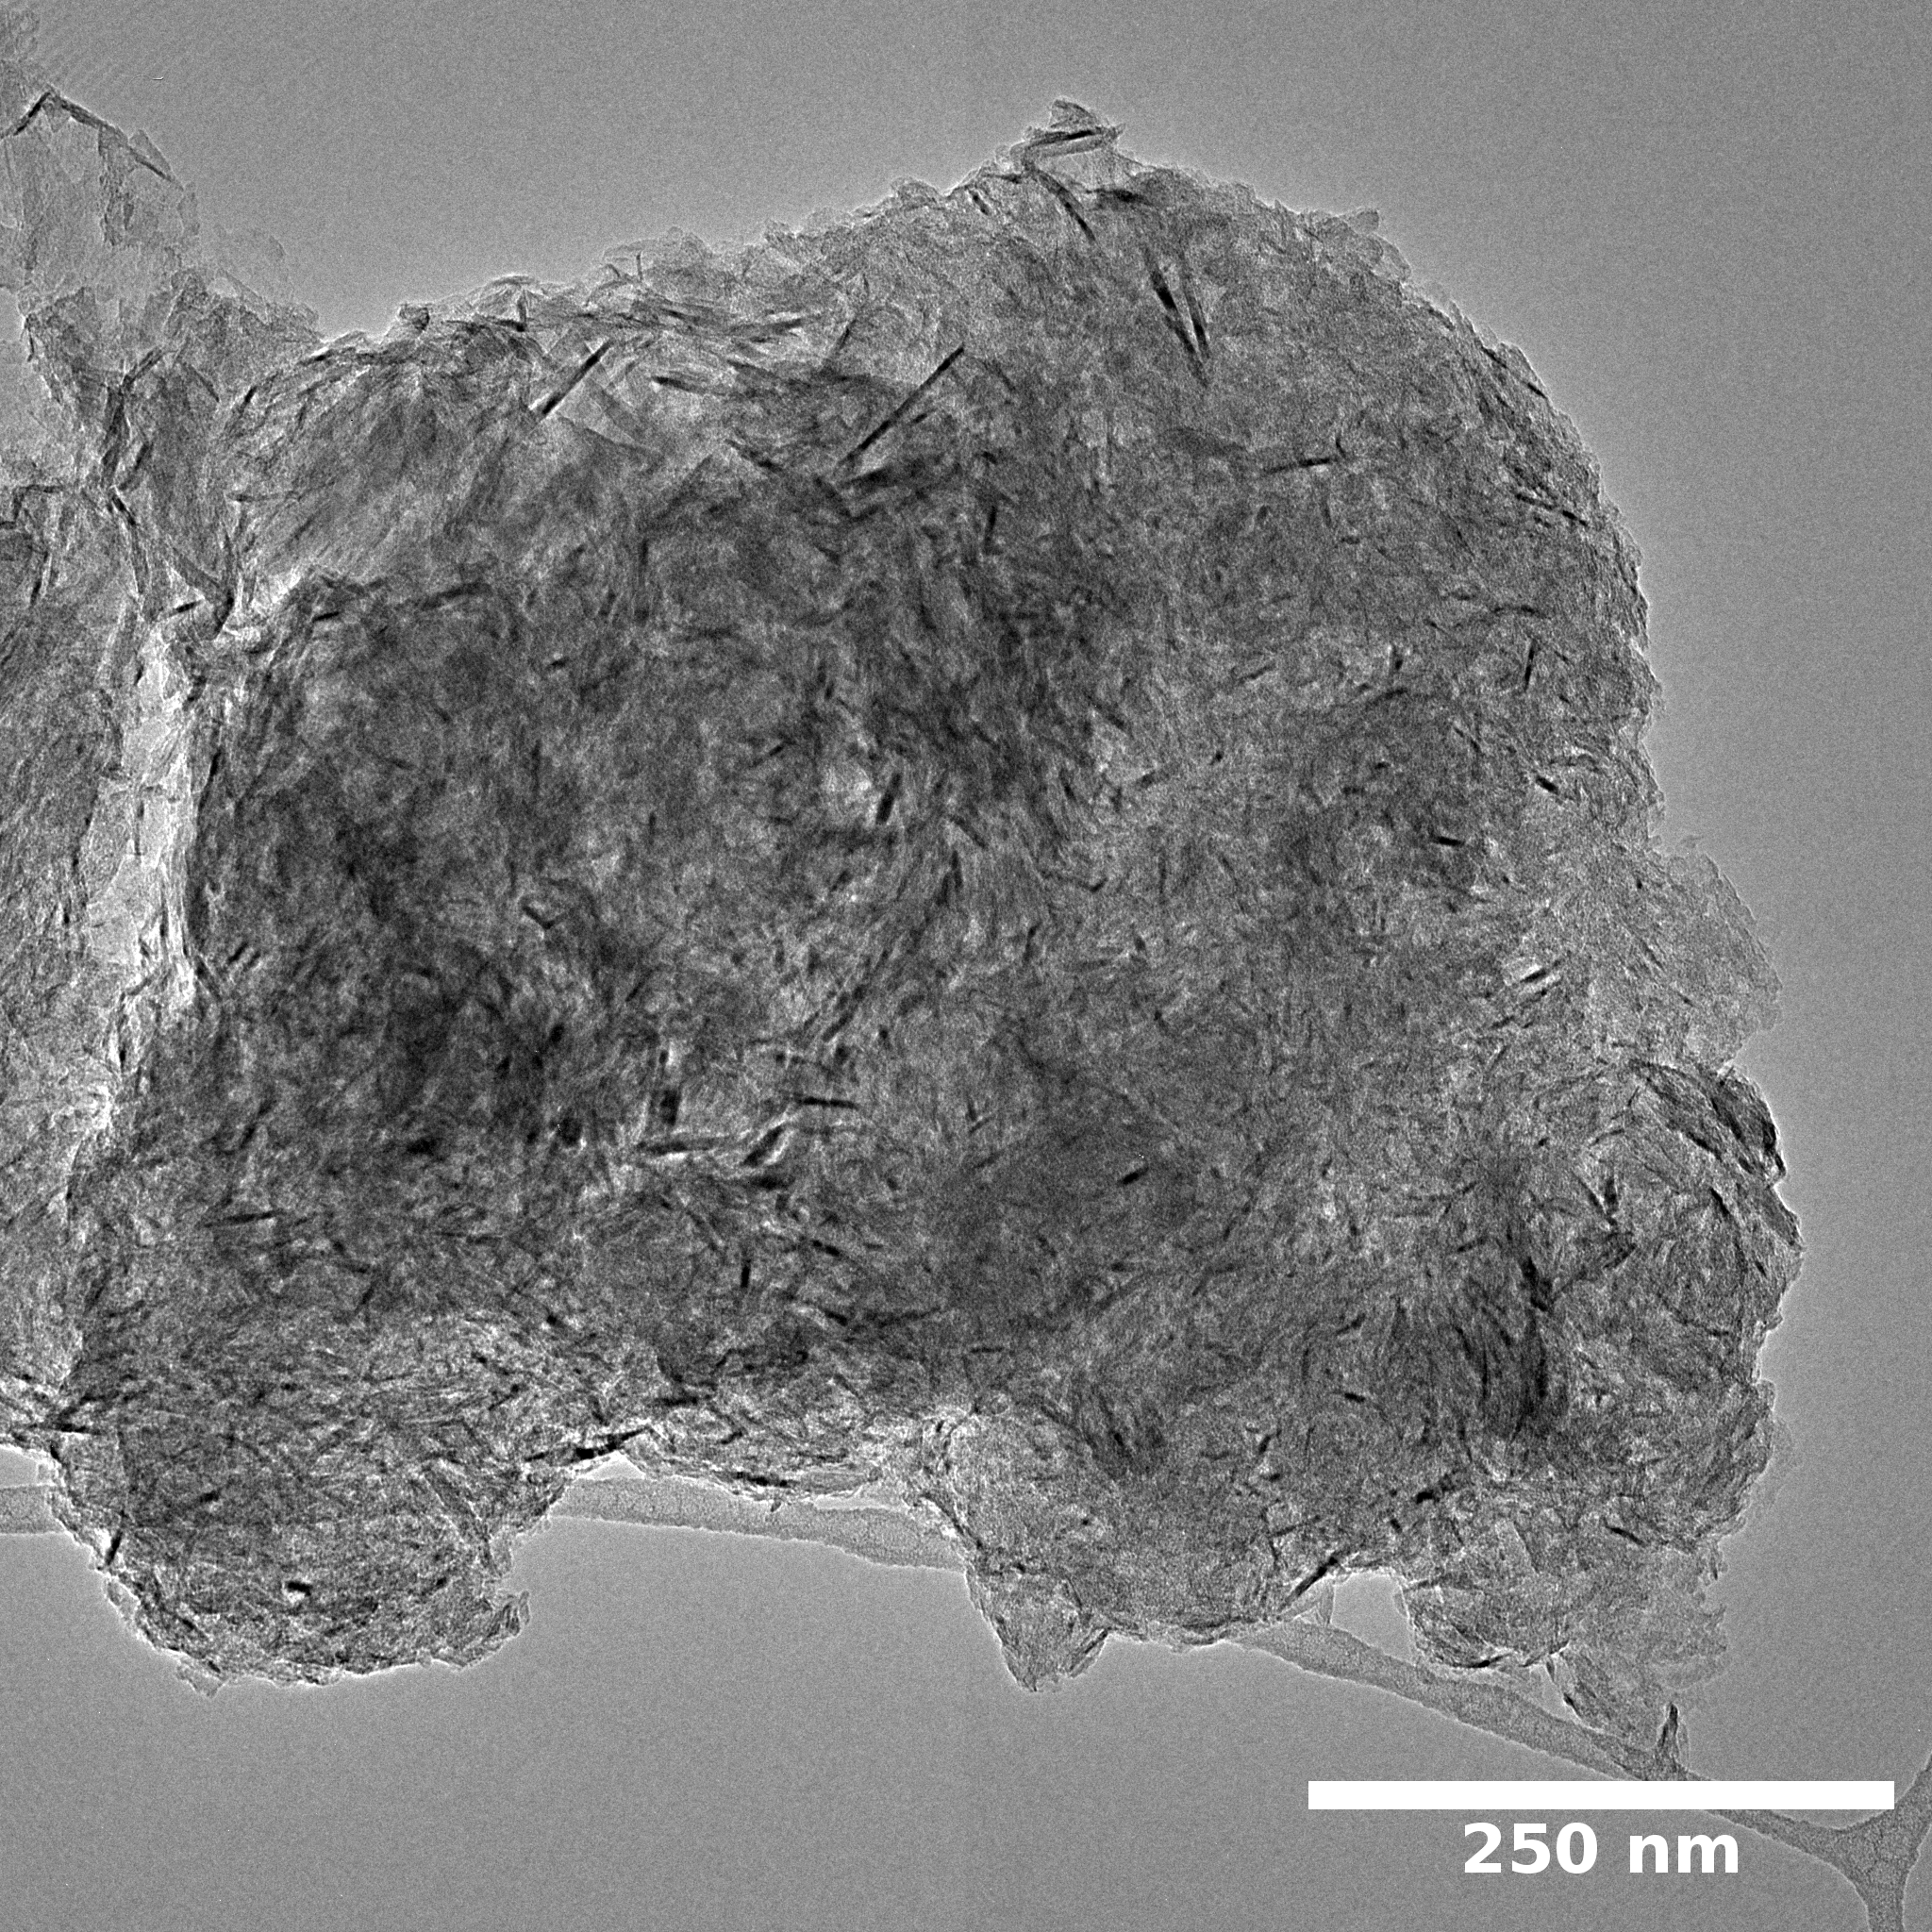
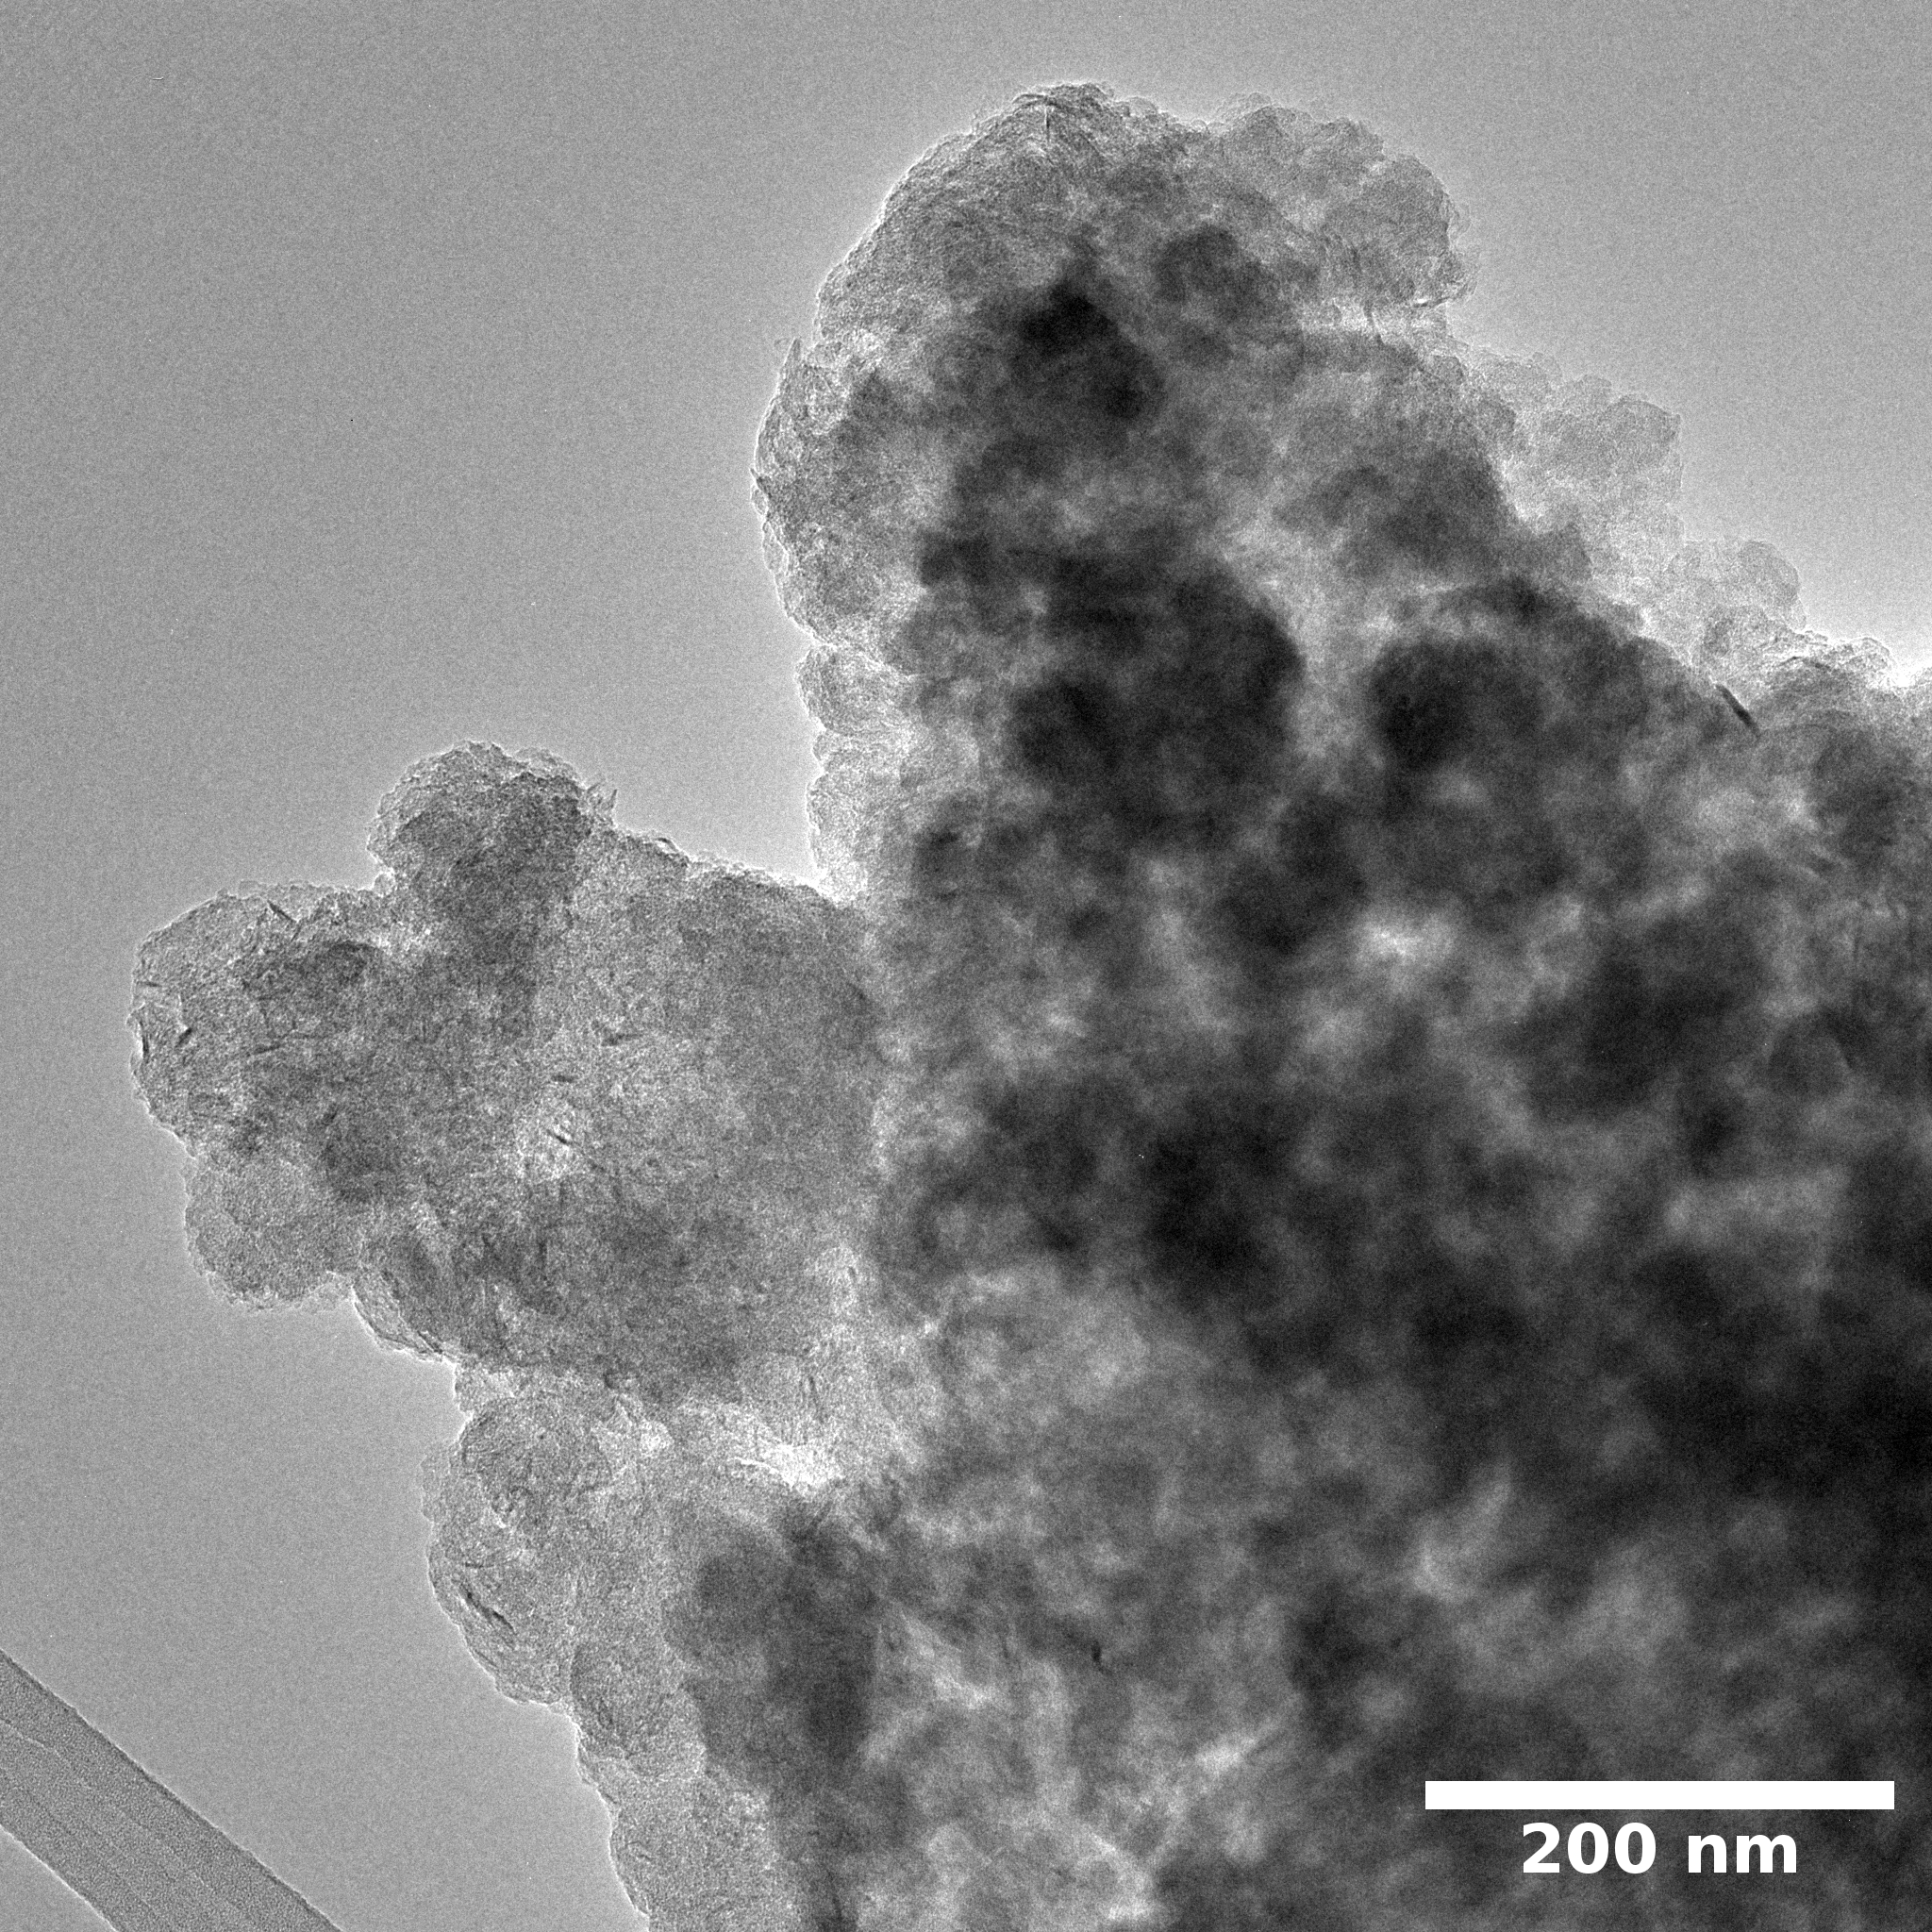
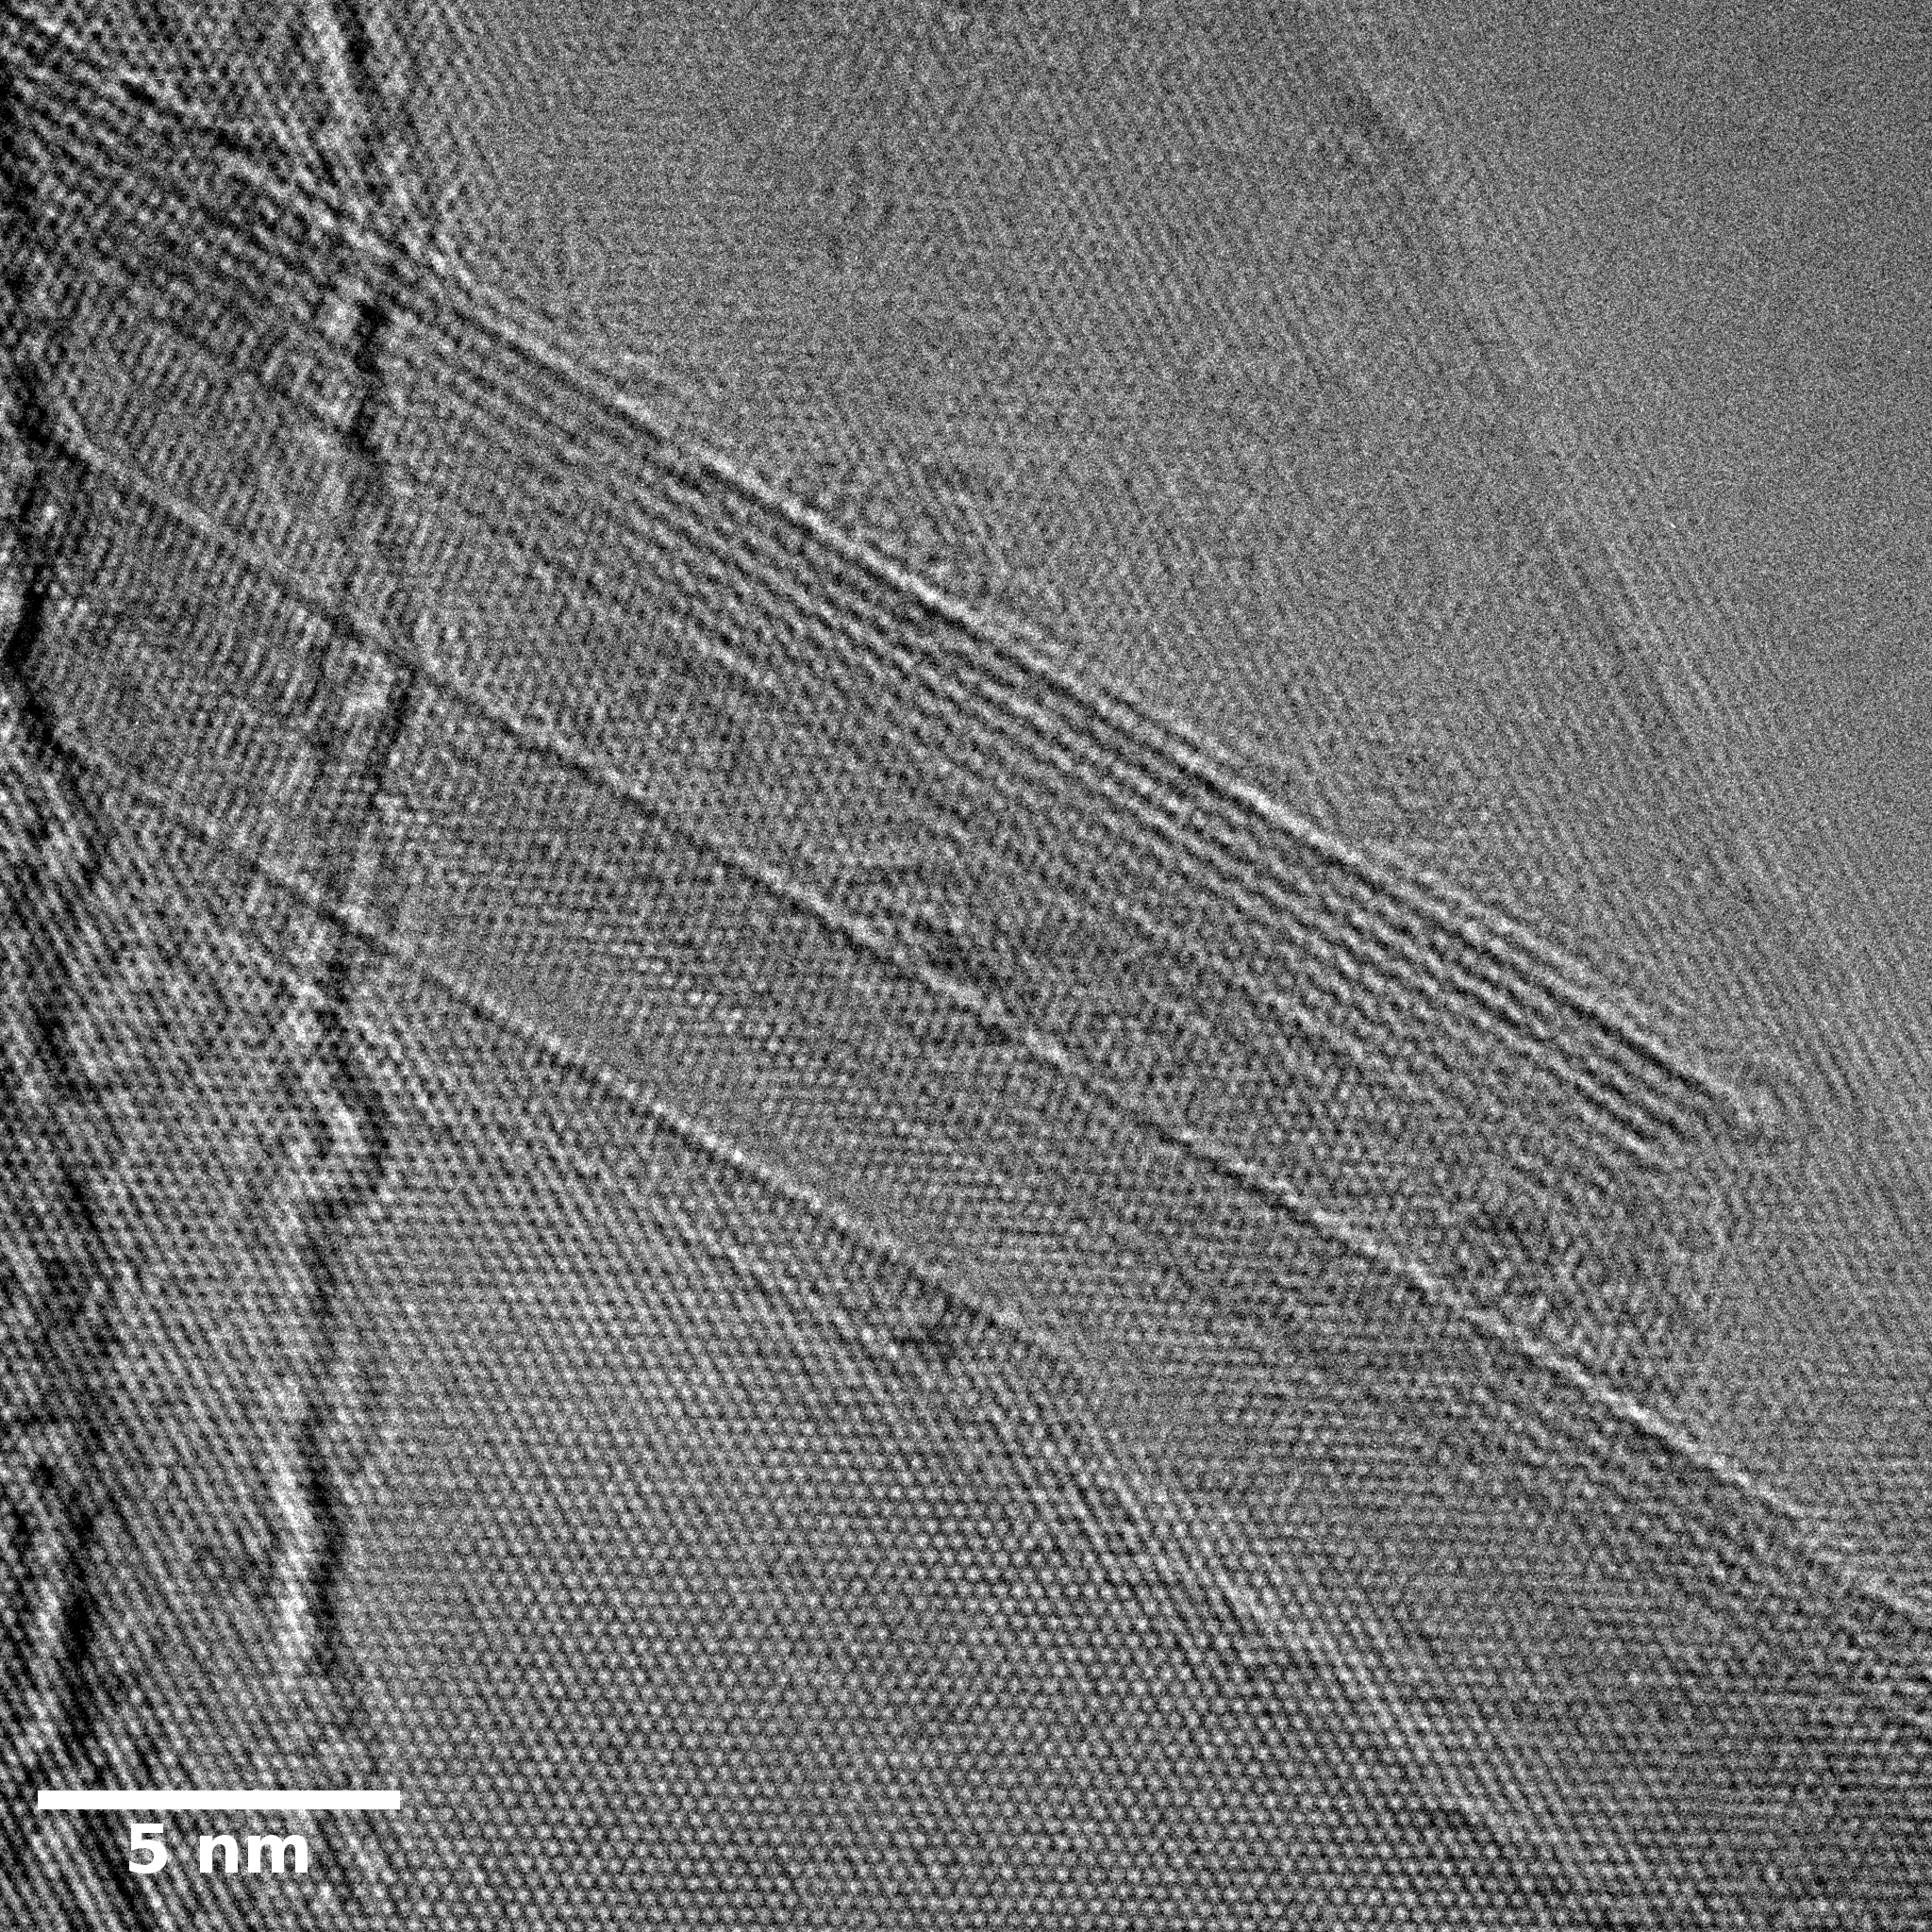
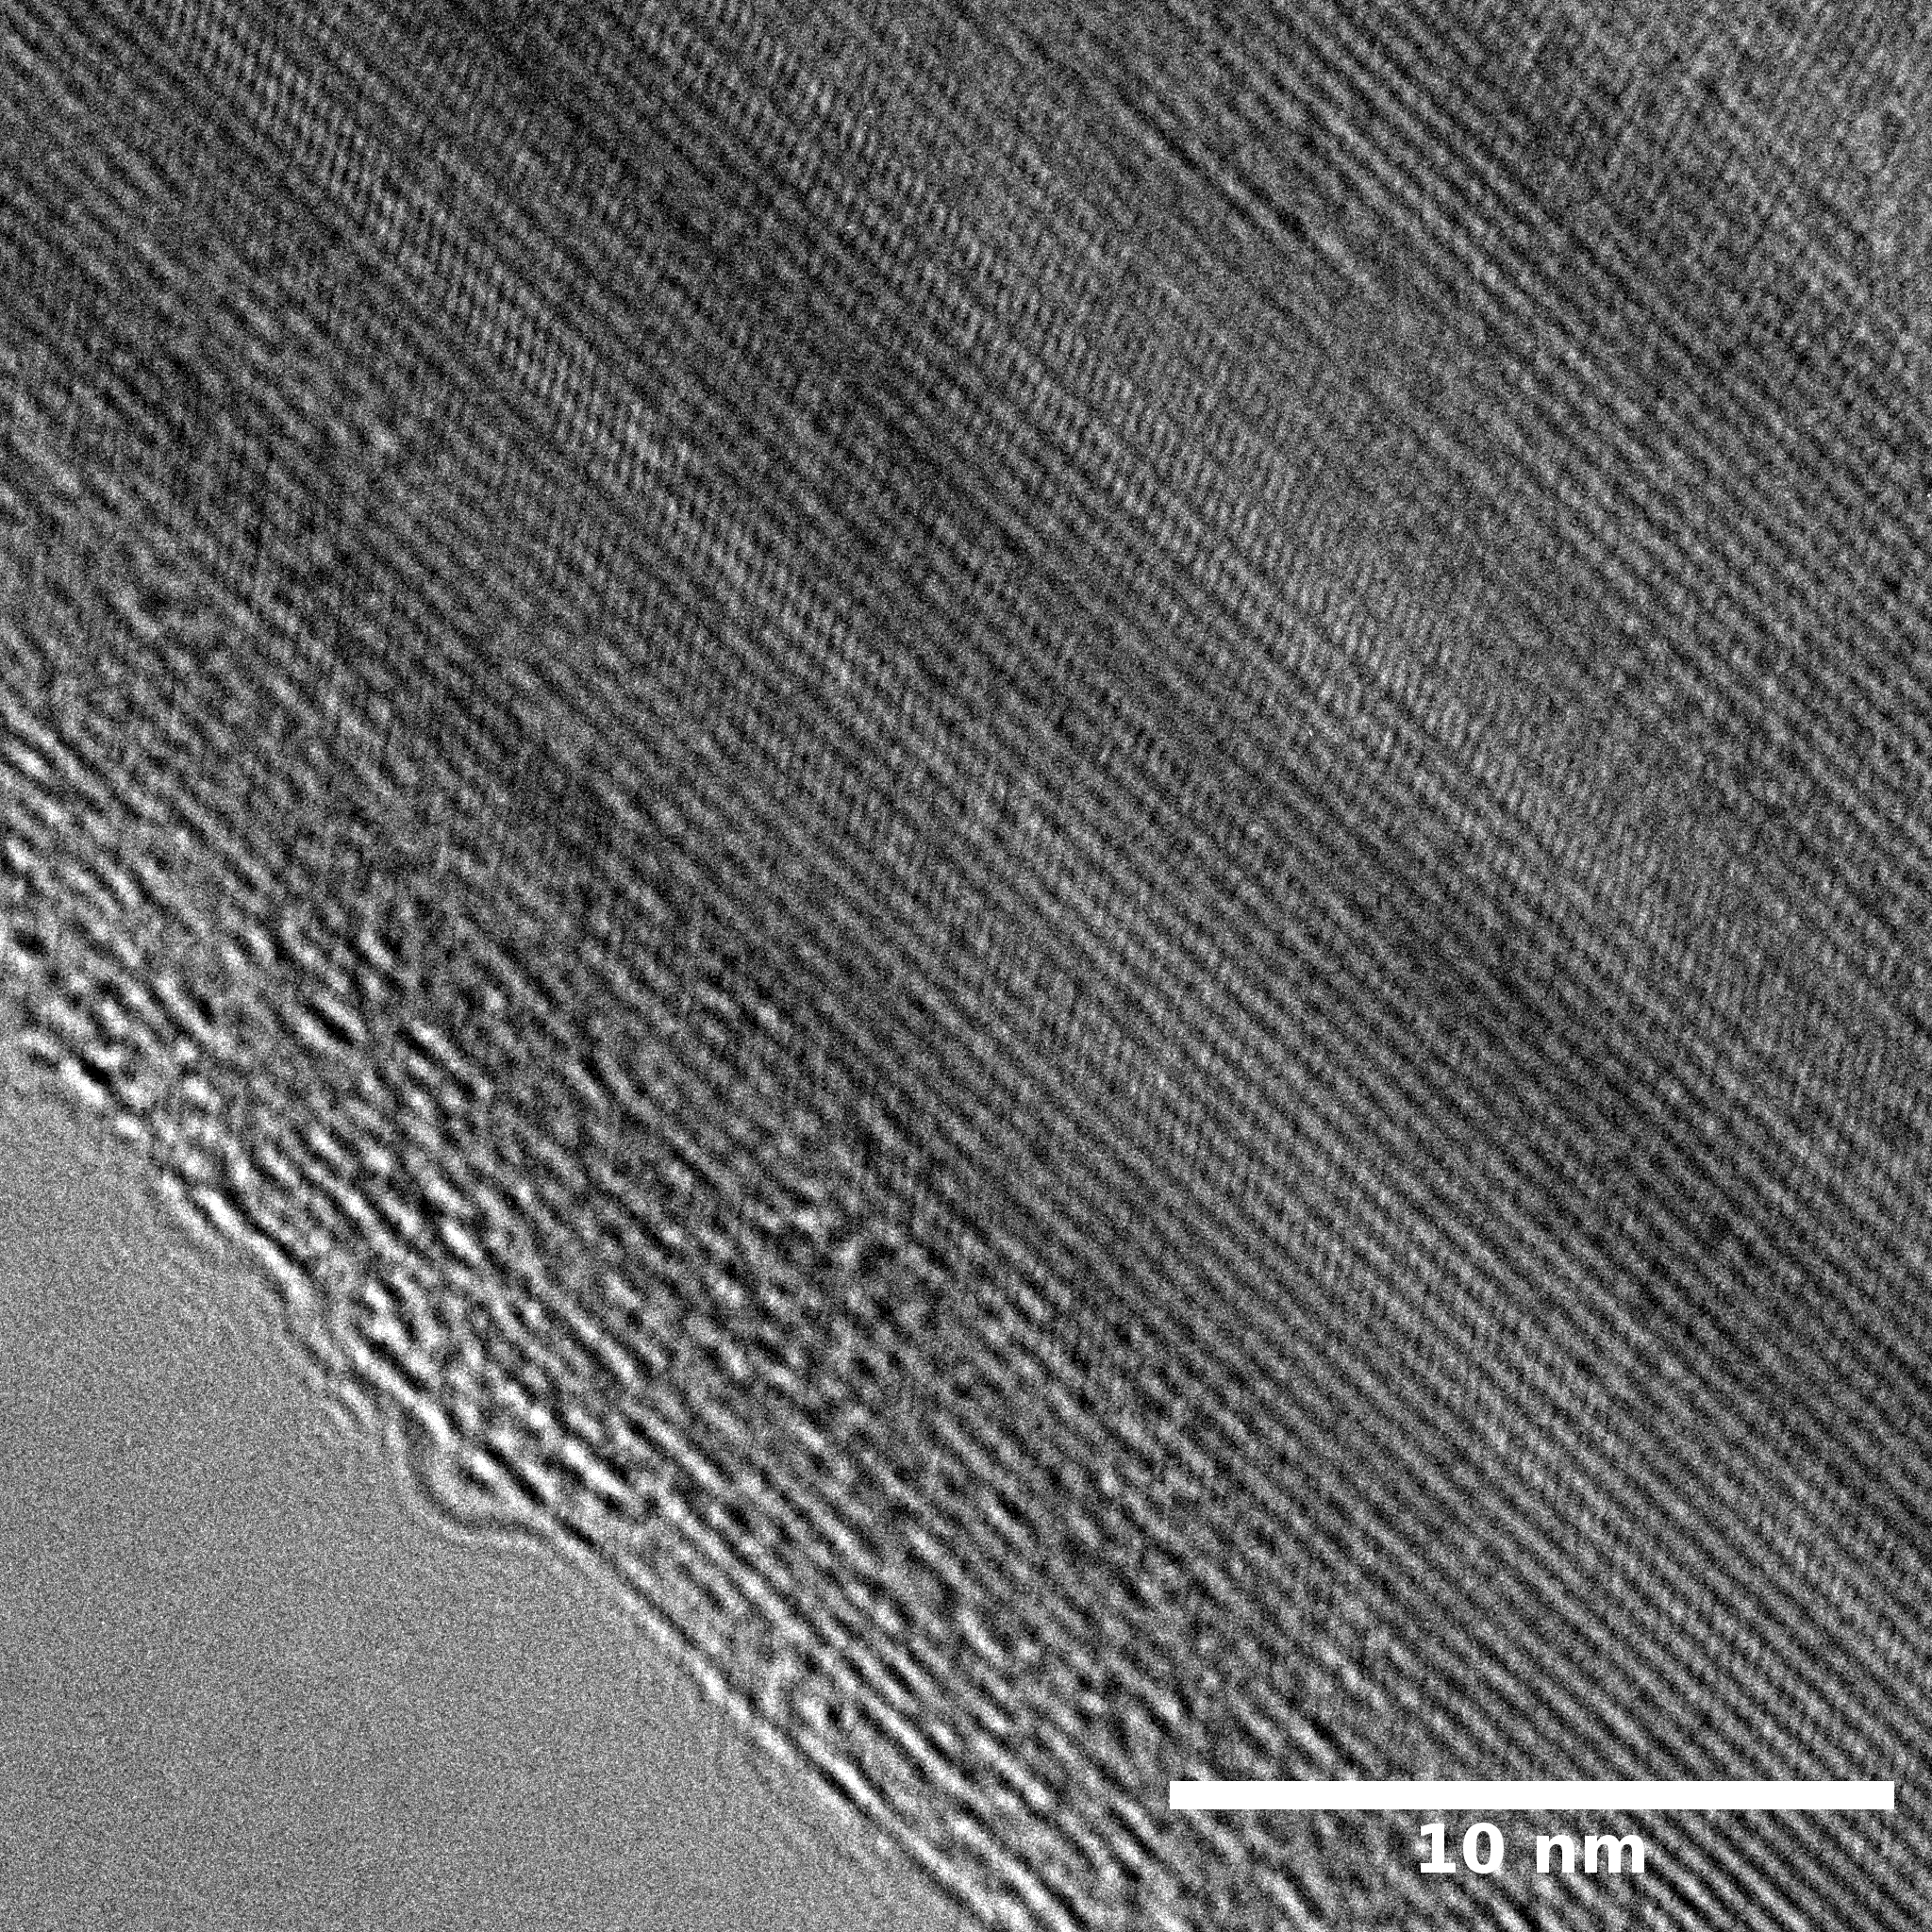
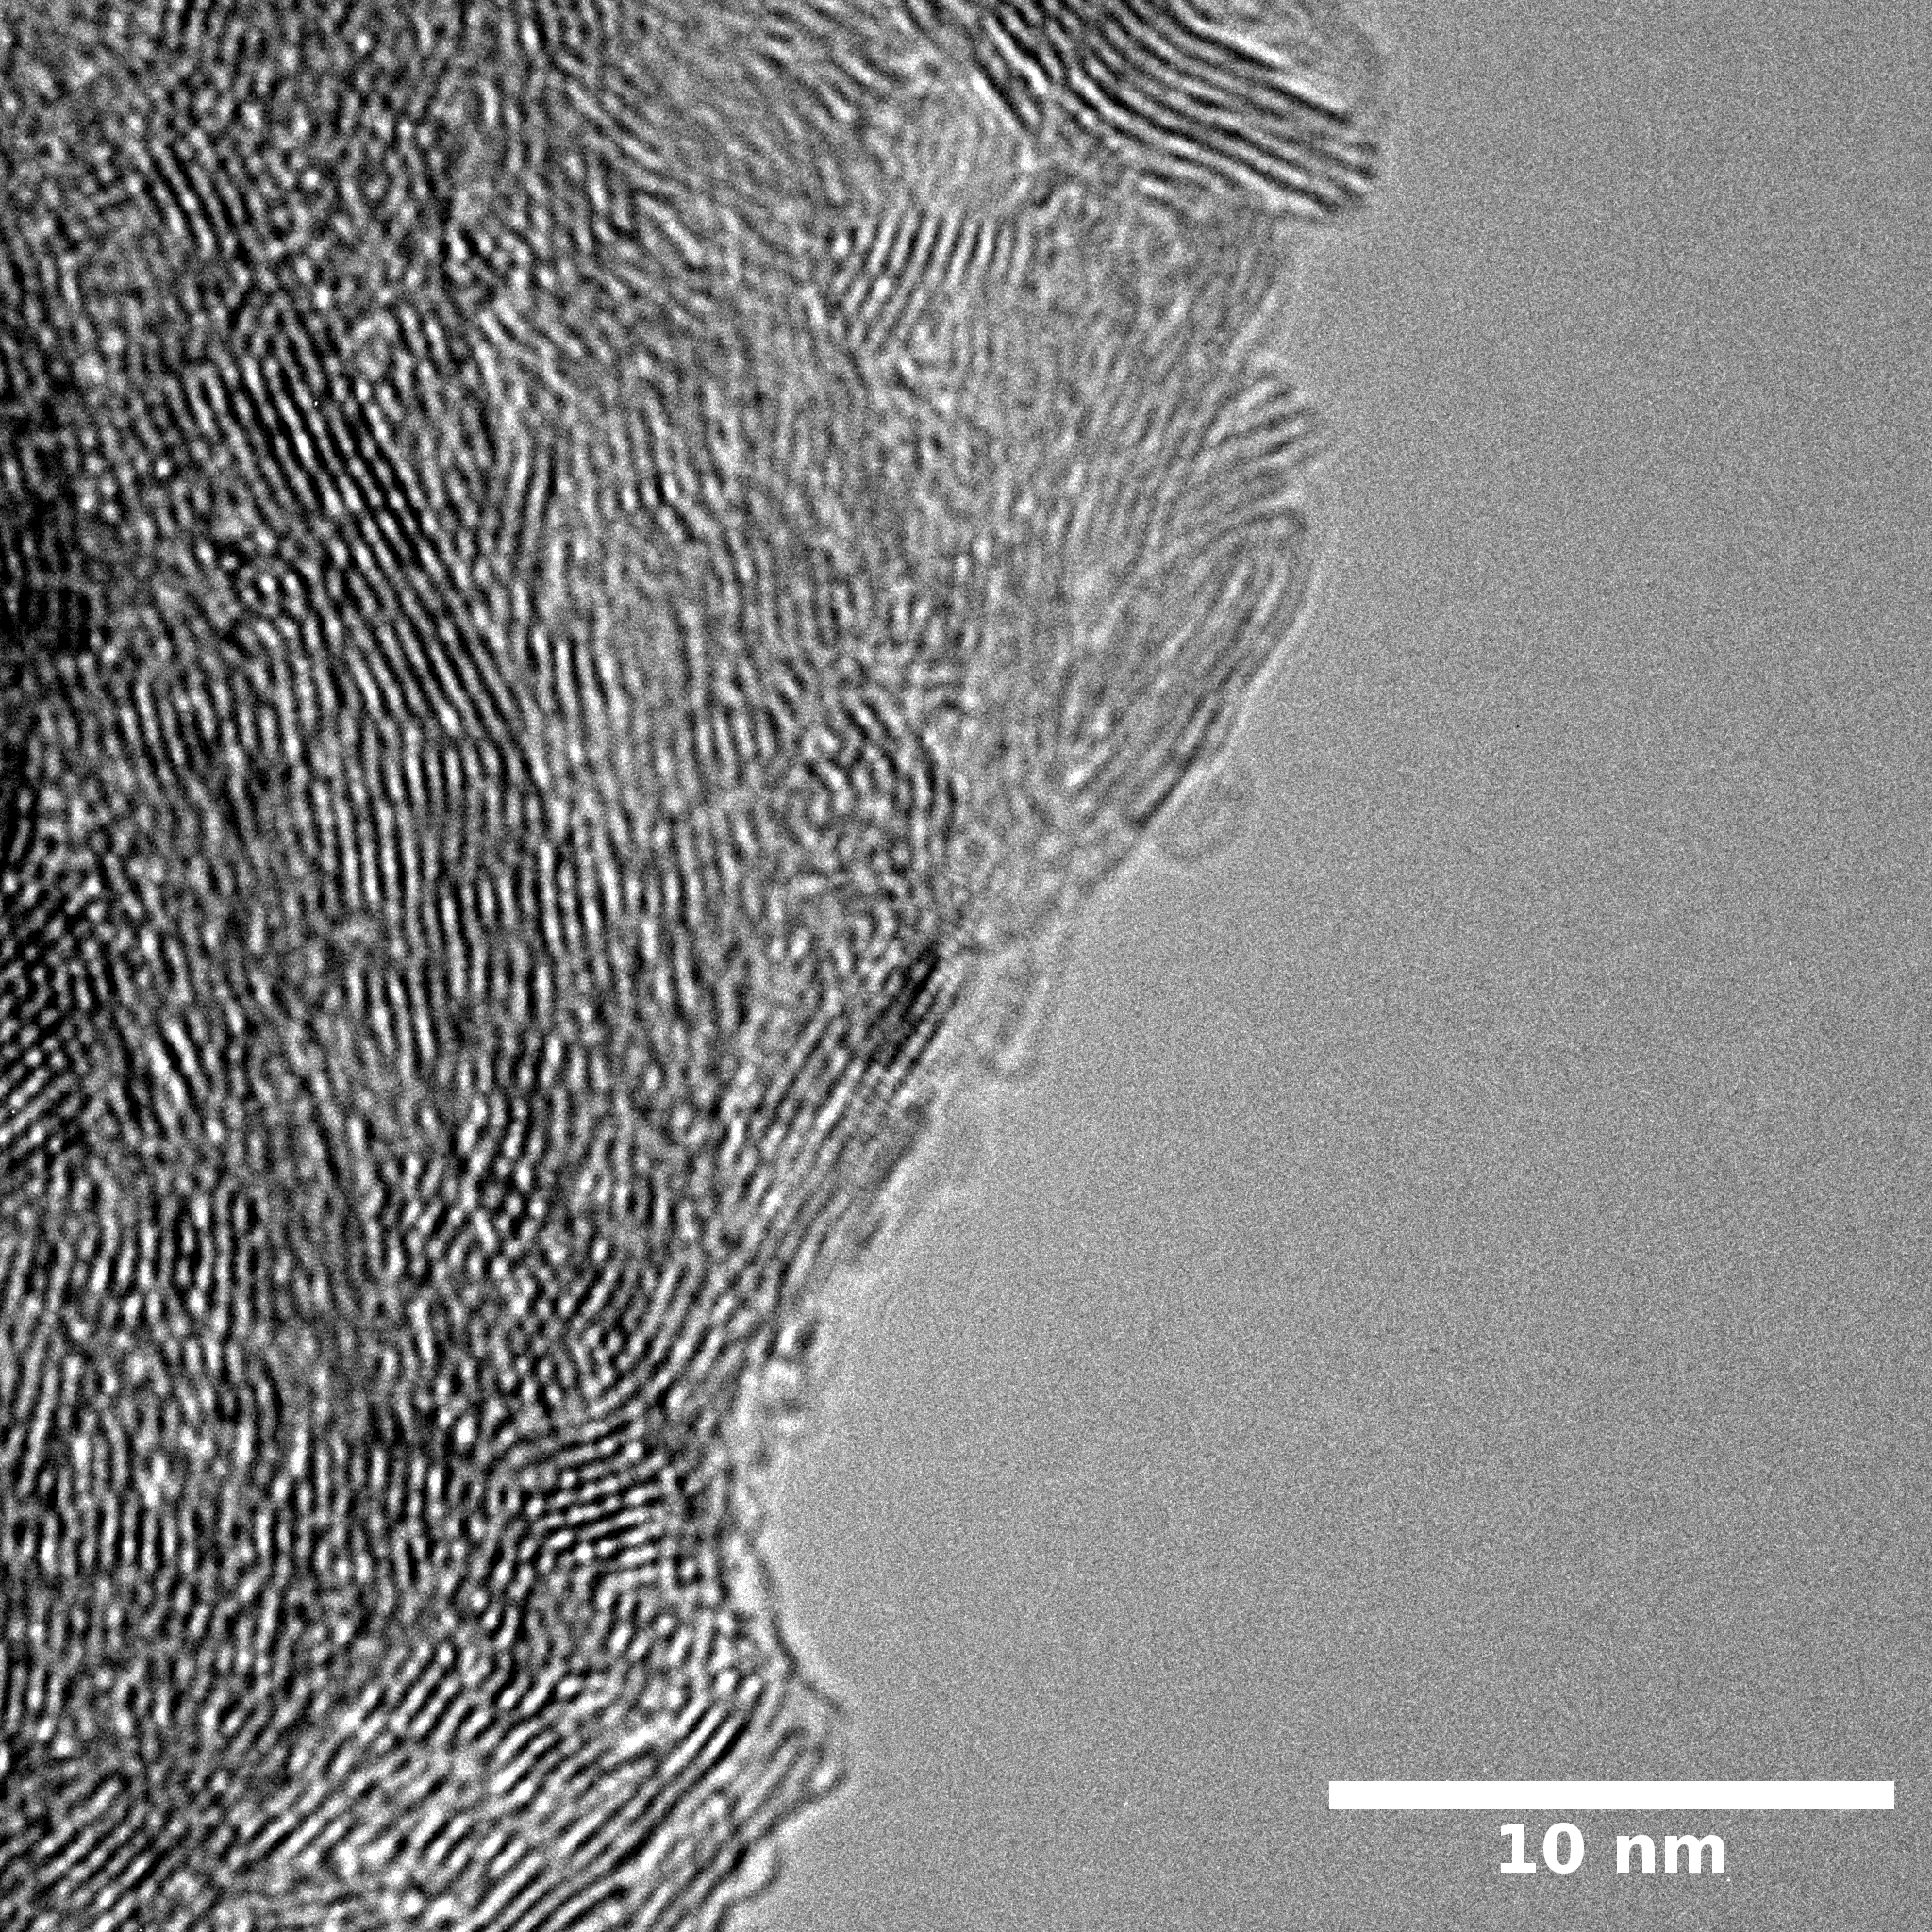
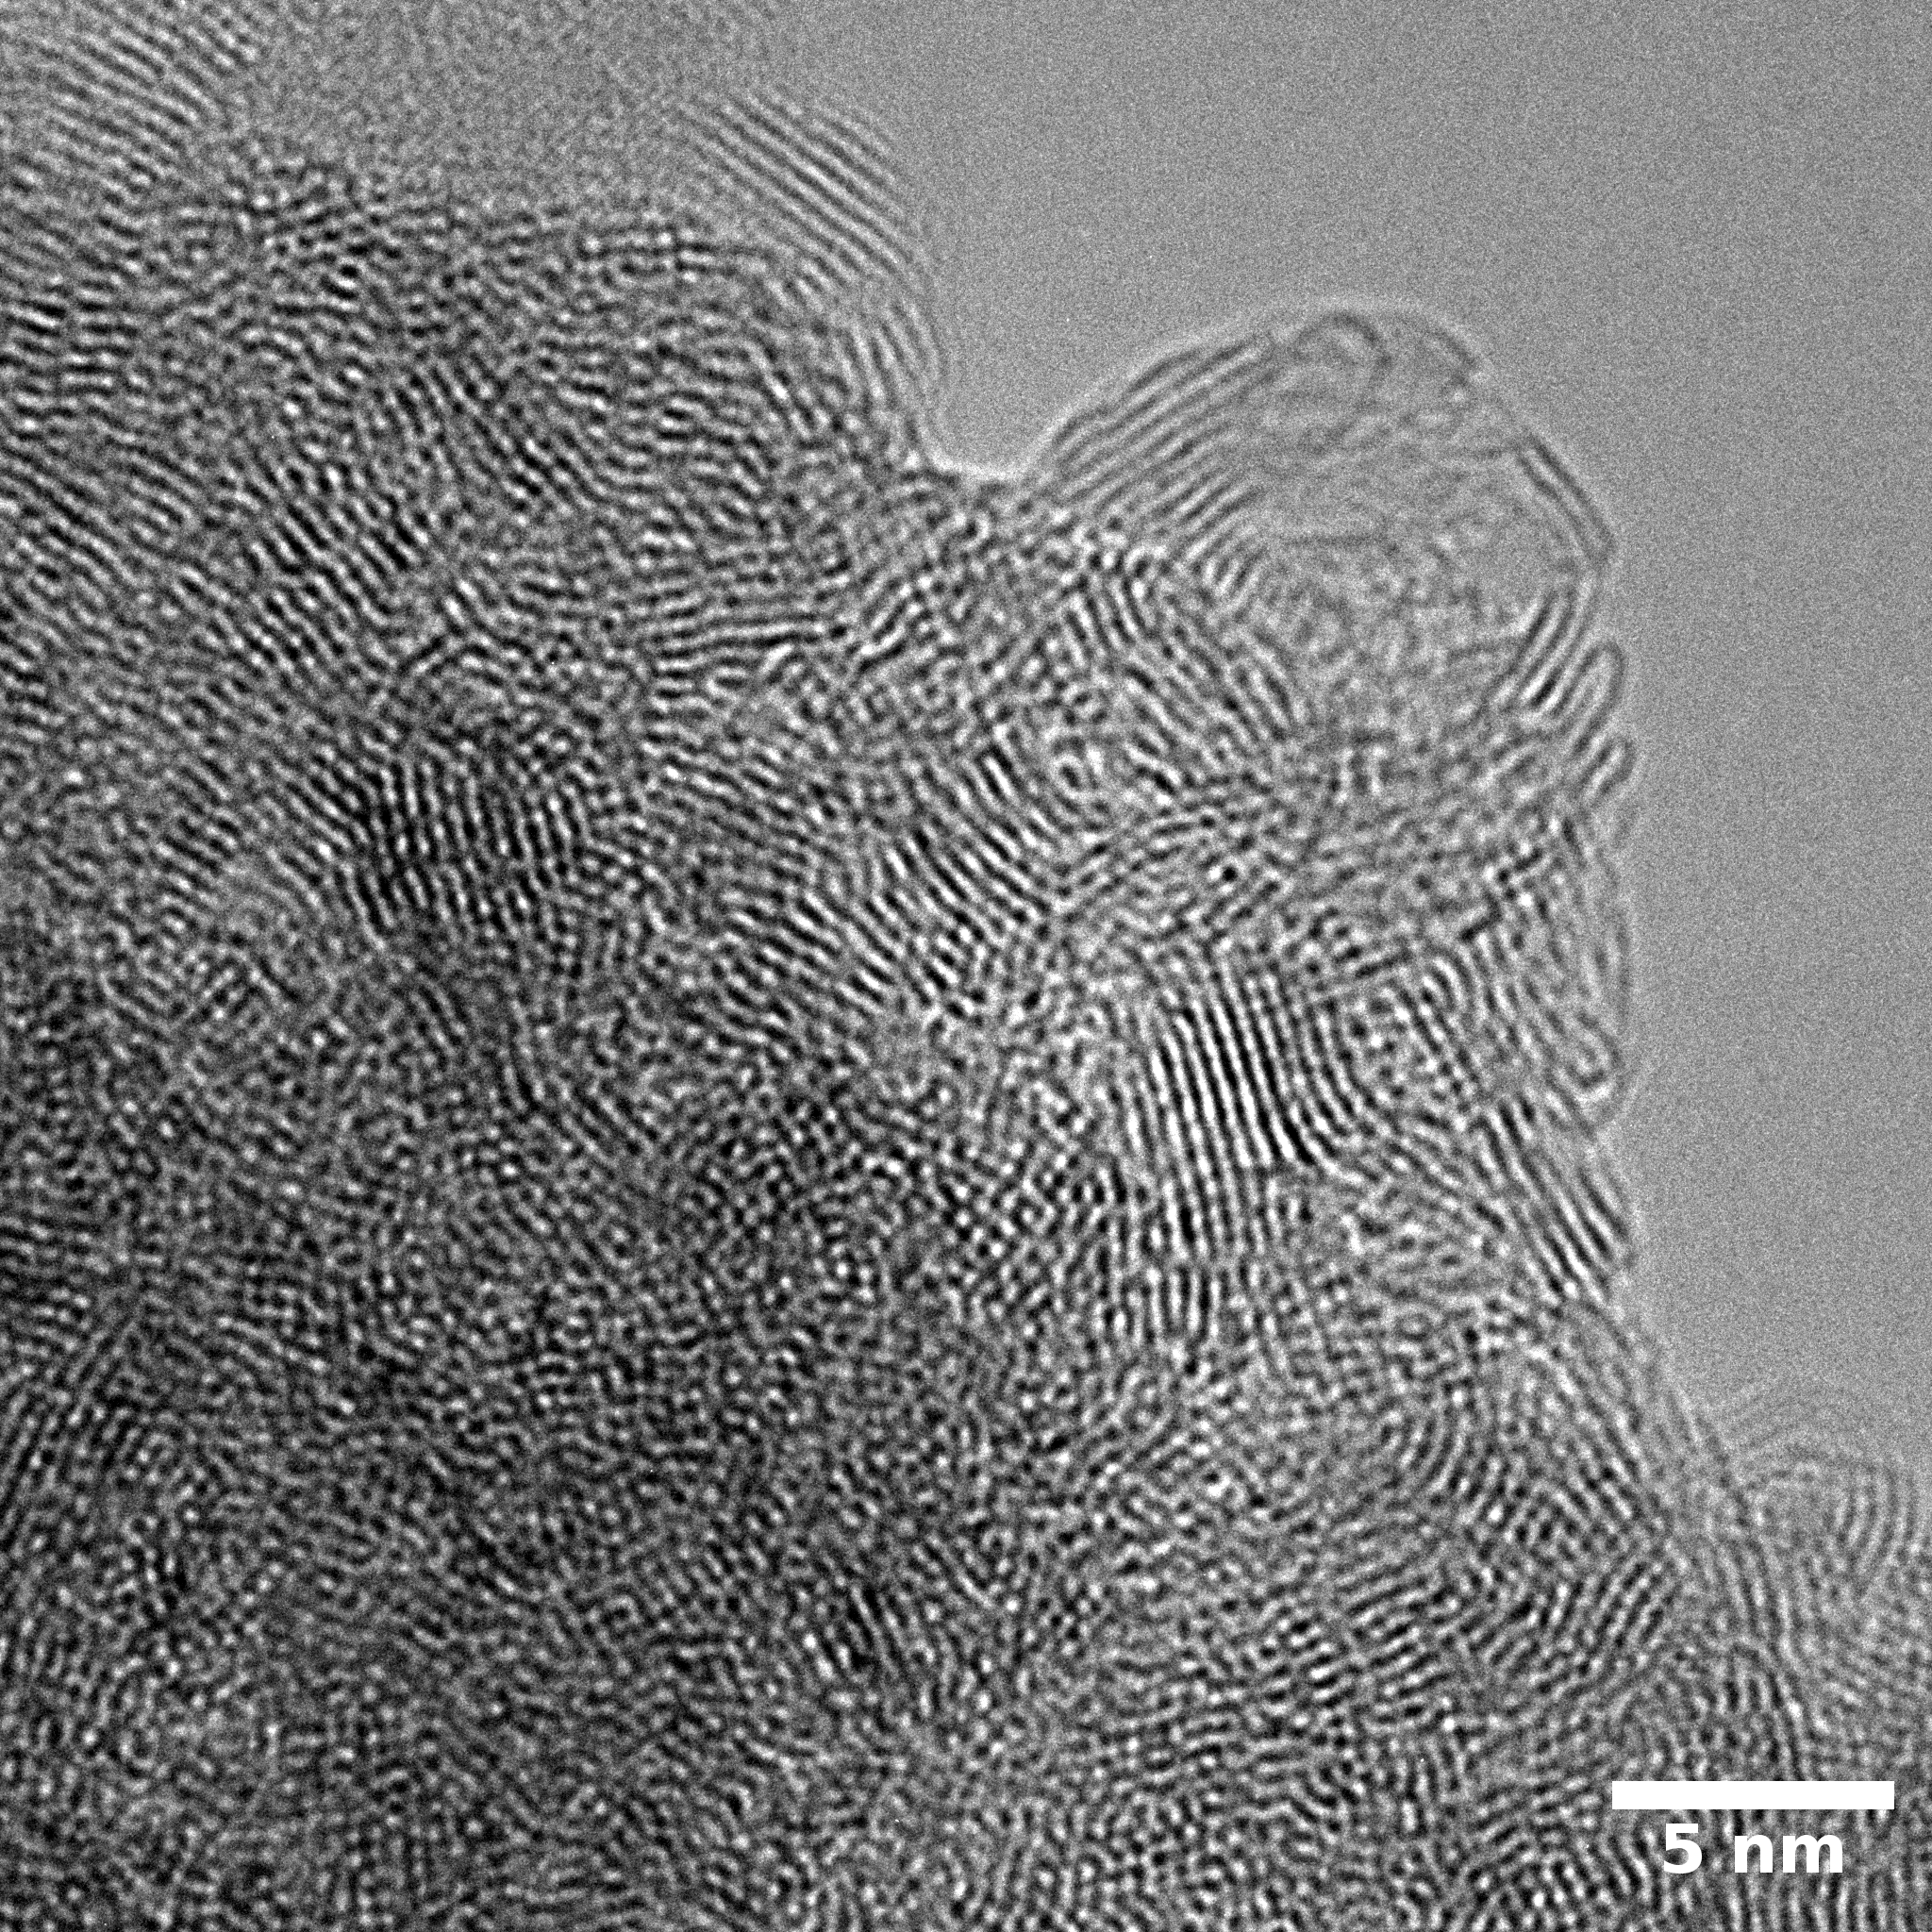
Sample treated at 450 r.p.m. contains particles which are aggregates of small and thin sheets. After increase of milling speed this structure disappears.


B : N ratio changes very slightly from sample to sample and probably lies inside error range.
| Sample |
mean B:N |
| dl100 |
49.1 : 50.9 |
| dl101 |
47.7 : 52.3 |
| dl102 |
53.5 : 46.5 |
TEM
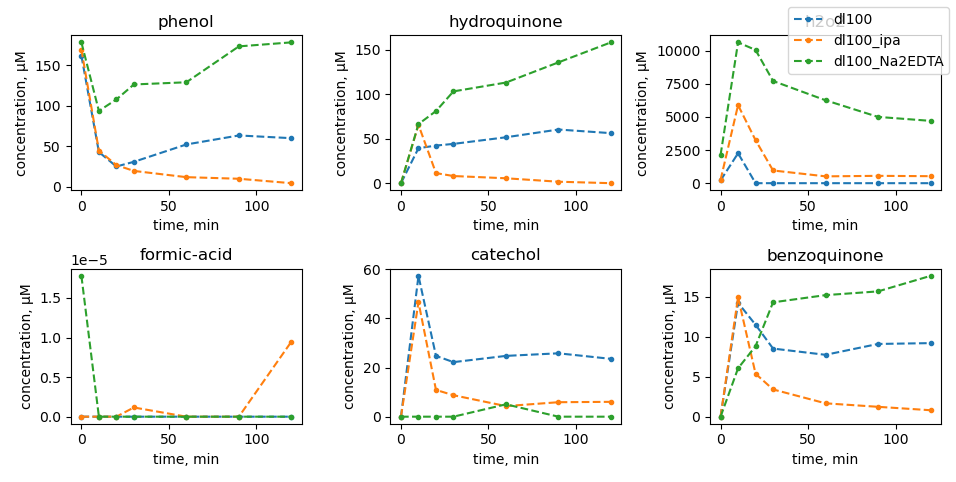
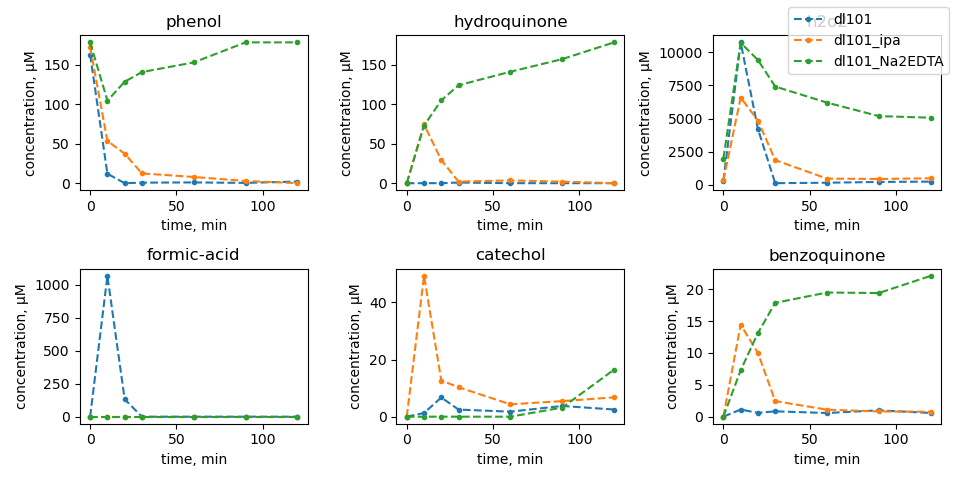
Phenol photooxidation
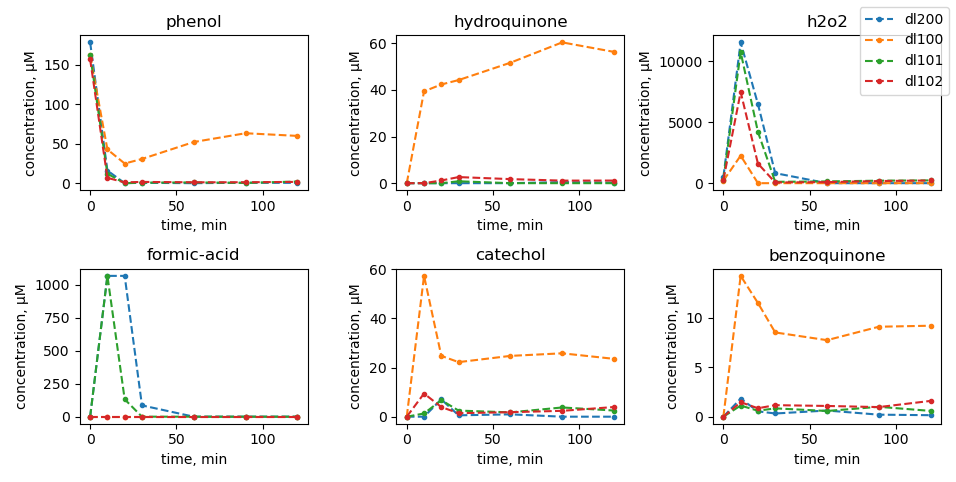
Scavenger tests
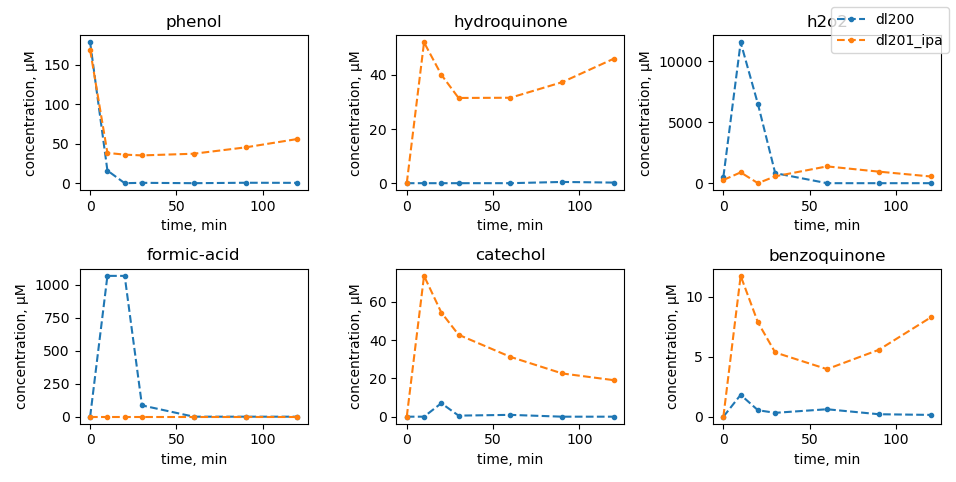 |
 |
 |
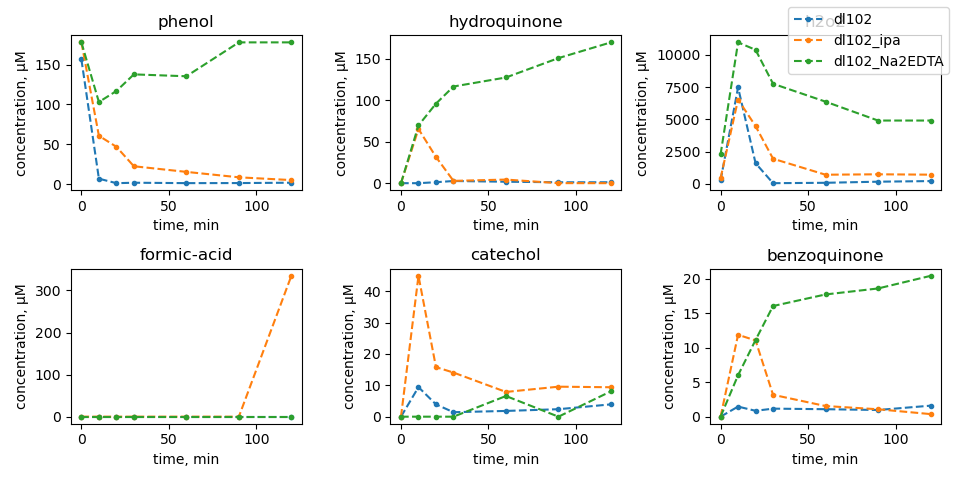 |
| no mill |
dl100: 450 rpm |
dl101: 600 rpm |
dl102: 750 rpm |
Terephthalic acid test
 |
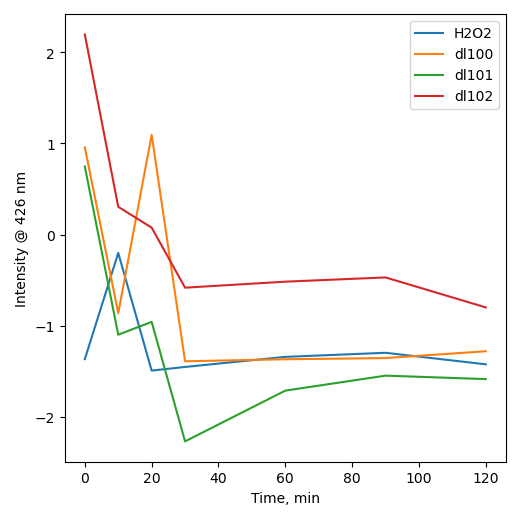 |
| H2O |
[H2O2]aq |
How does ball milling of micron h-BN with melamine influence its characteristics?
Color change is noticeable only after ball-milling at 750 r.p.m. and it's not uniform throughout the sample after drying.


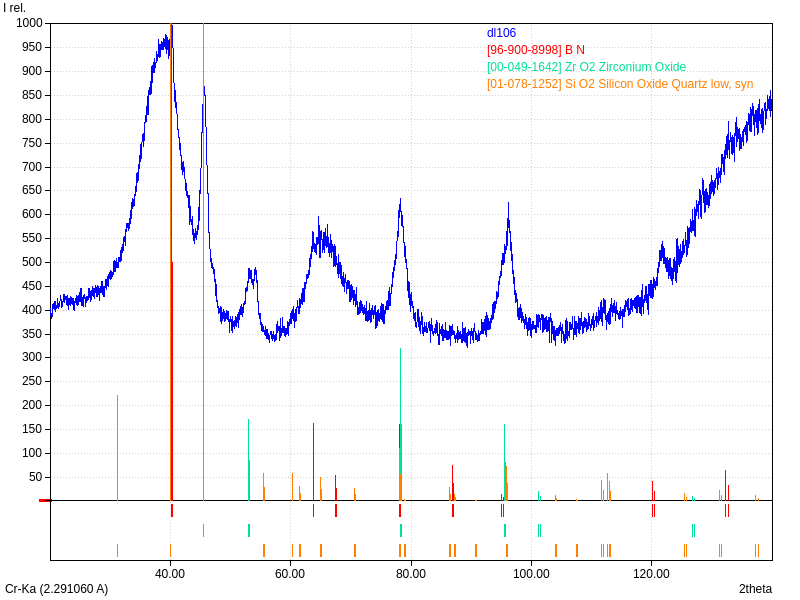
XRD
Samples consist of single h-BN phase. Peaks corresponding to (002) plane shift towards lower Bragg's angle which can be explained by increased interplanar distance. Also peaks become broader, however, change is less evident in comparison to ball-milling of pure h-BN powder.

FTIR
FTIR spectra consist of B-N-B stretching and bending peaks. Peaks remain almost intact with the increase of ball-milling speed. C-N stretching mode peak appears at 1630 cm-1 and its intensity increases after increase of ball-milling speed. Also there are peaks at 2540 and 2340 cm-1 corresponding to C-N bond which can be explained by the formation of BCN structure or by the melamine residuals in the samples after washing. O-H and N-H bonds present in all samples and their intensity increase with the increase of ball-milling speed.

Raman
Increase of ball-milling speed results in decrease of h-BN peak at 1366 cm-1. Also, there is an increase of wide halo intensity.
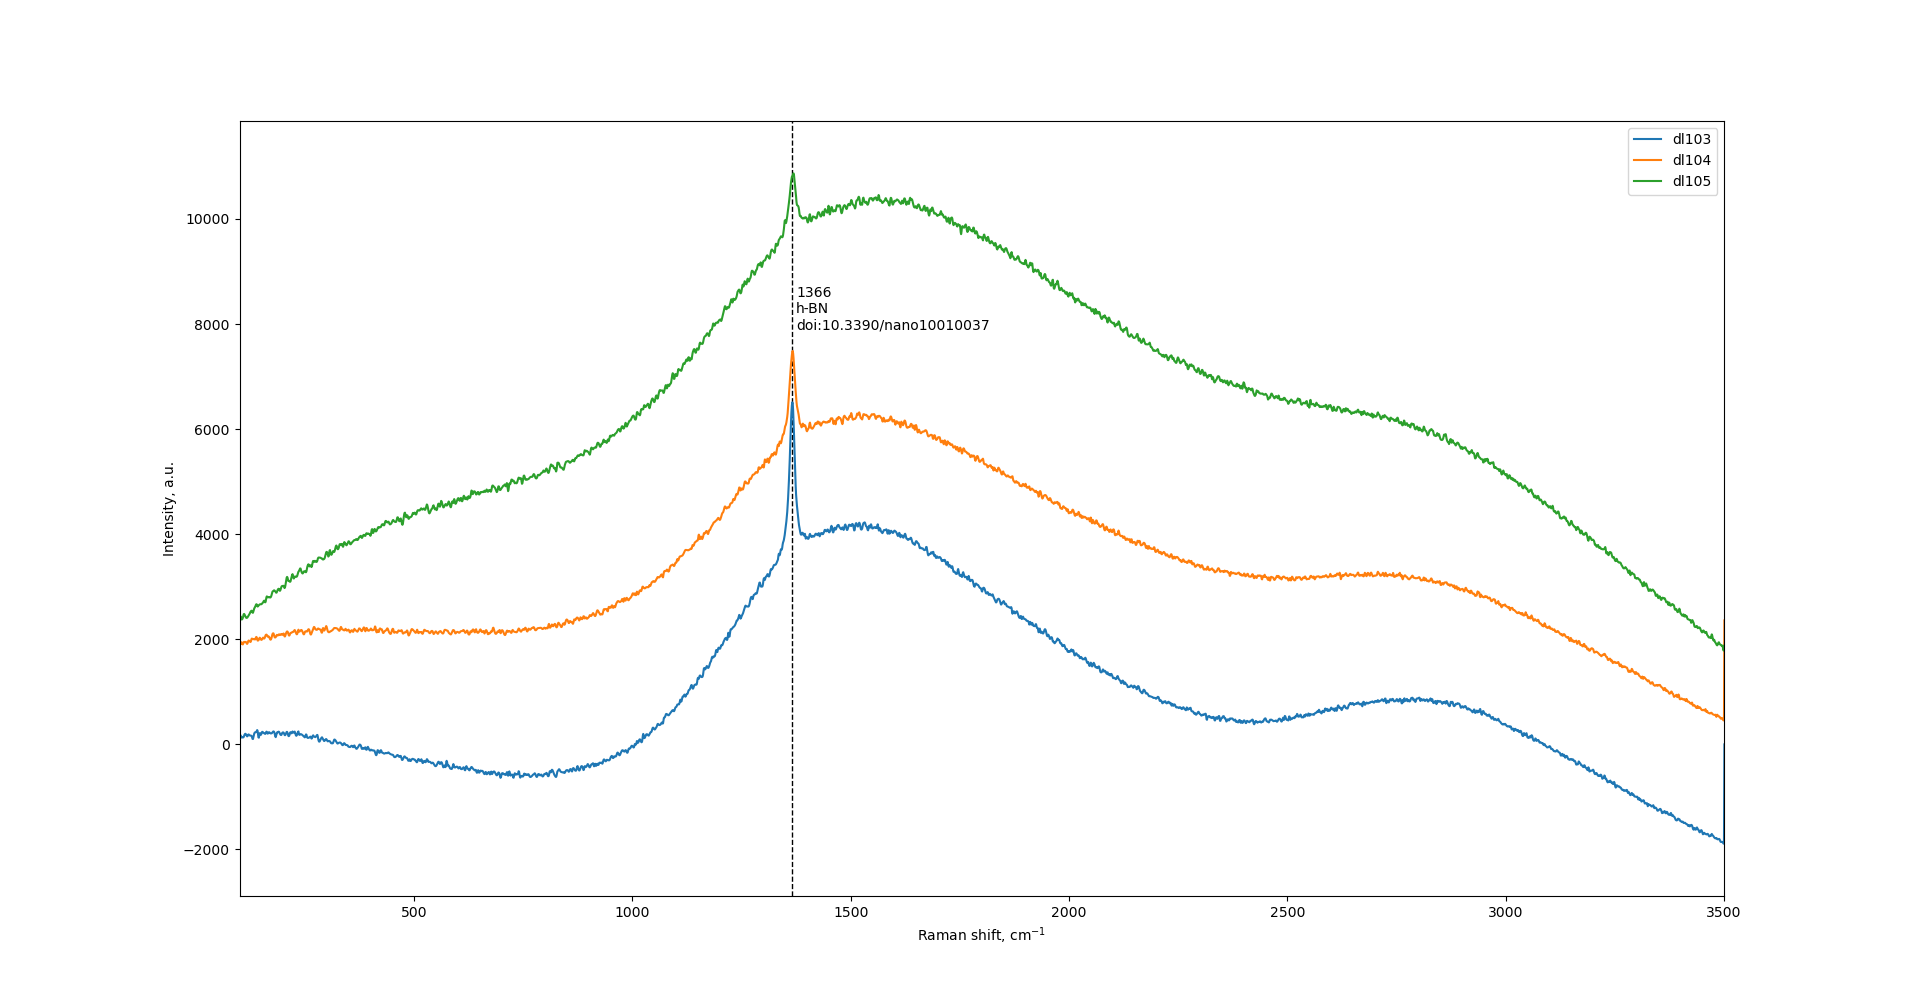 |
| dl103: 450 r.p.m.; dl104: 600 r.p.m.; dl105: 750 r.p.m. |
Pulse titration and TPD
Adsorption is almost unchanged with the increase of ball-milling speed. There is an increase of CO2 signal at temperatures above 500°C for all samples which, however, may originate from melamine residues on the surface of samples. Sample ball-milled at 750 r.p.m. has substantially increased signal and peak at ca. 400°C, which may originate from CO2 desorption. Activation of sample in H2 flow result in the increase of CO2 adsorption. However, desorption peak at 400°C disappears and signal is much weaker during desorption, thus, the result cannot be interpreted as desorption of CO2 and most probably originated from melamine residues.
| sample |
ball-milling speed |
CO2 adsorption (H2 activated) |
|
r.p.m. |
μmol/g |
| dl103 |
450 |
0 |
| dl104 |
600 |
0.071 |
| dl105 |
750 |
0.036 (0.223) |
 |
 |
 |
| 450 r.p.m. |
600 r.p.m. |
750 r.p.m. |
 |
| 750 r.p.m., H2 activated |
UV-vis and bandgap
Samples have absorbance peak at 190 - 200 nm which remains almost unchanged with increase of ball-milling speed with melamine.

Direct bandgap energy increases slightly with the increase of ball-milling speed from 5.01 to 5.51 eV. Indirect bandgap is almost unchanged with the increase of ball-milling speed and equals to ca. 5.3 eV.

BET
Surface area increases with increase of ball-milling speed up to 600 r.p.m. and then decreases.
| sample |
ball-milling speed |
Ssp |
|
r.p.m. |
m2 |
| dl103 |
450 |
81.4 |
| dl104 |
600 |
100.5 |
| dl105 |
750 |
72.1 |
SEM and EDX
Samples consist of particles 1 - 10 μm. Size of particles does not change drastically with increase of milling speed. Particles of samples milled at 450 and 600 are aggregates of thin sheet-like particles. Thus, addition of melamine into the system leads to the exfoliation of boron nitride. Increase of milling speed to 750 r.p.m. results in disappearance of exfoliated structures.
B : N ratio remains almost unchanged from sample to sample.
| Sample |
mean B:N |
| dl103 |
49.8 : 50.2 |
| dl104 |
46.2 : 53.8 |
| dl105 |
48.0 : 52.0 |
How does ball milling of micron h-BN with glucosamine influence its characteristics?
Plazmoterm micro BN A powder was vacuum annealed at 1400°C for 4 hr. The resulting powder was mixed with D-Glucosamine HCl and ball milled in Ar at 750 r.p.m. for 8 hr in 5 min work + 5 min pause regime (2x12 10 mm YSZ balls, YSZ jars, b/s ratio = 33). Weight of h-BN to weight of GA changed from sample to sample. After ball-milling samples were dispersed in water media via ultrasonication with sonotrode for 10 min at 50% power. After dispersing, powders were washed with water in centrifuge and dried in IPA media at ambient conditions.
CHNS analysis
The amount of carbon is increased after ball-milling of sample with glucosamine.
| Sample
| GA:BN
| C content, wt.%
|
| dl202 |
no GA |
0.44 |
| dl124 |
1:7 |
3.80 |
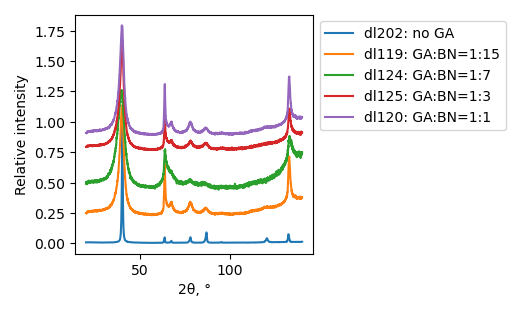
XRD
Samples consist only of h-BN phase. FWHM value increases after ball-milling, however there is no trivial dependence on GA:BN ratio.
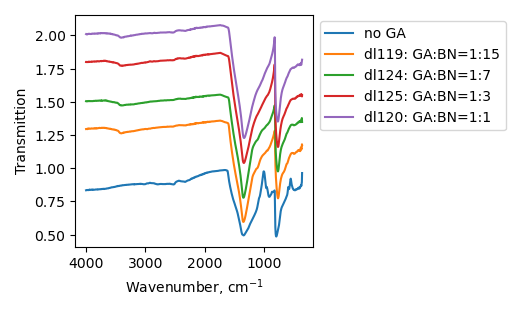
FTIR
Samples consist of B-N, B-O, N-H, O-H and C-N bonds. Amount of B-O bond decreases at GA:BN ratio increase. N-H, as well as C-N peaks remain almost unchanged with GA:BN ratio change.
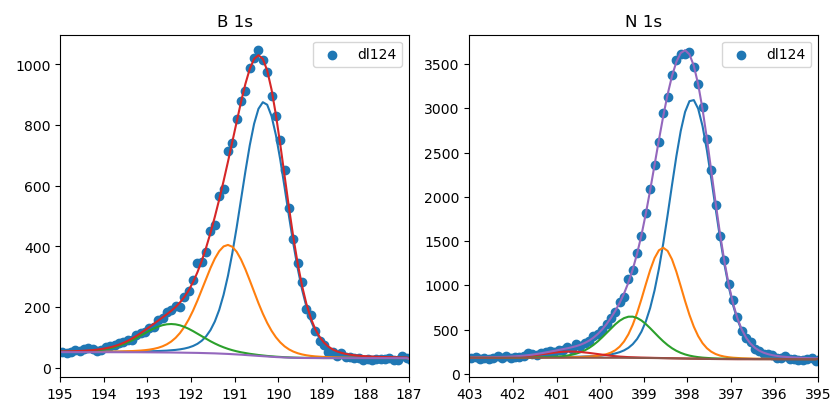
XPS
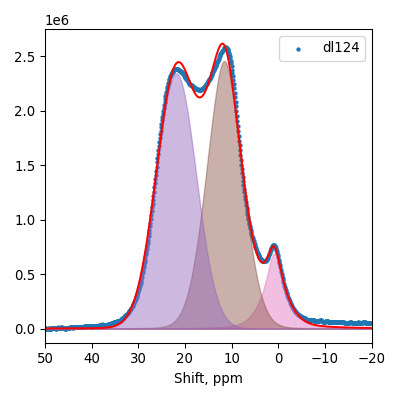
11B MAS NMR
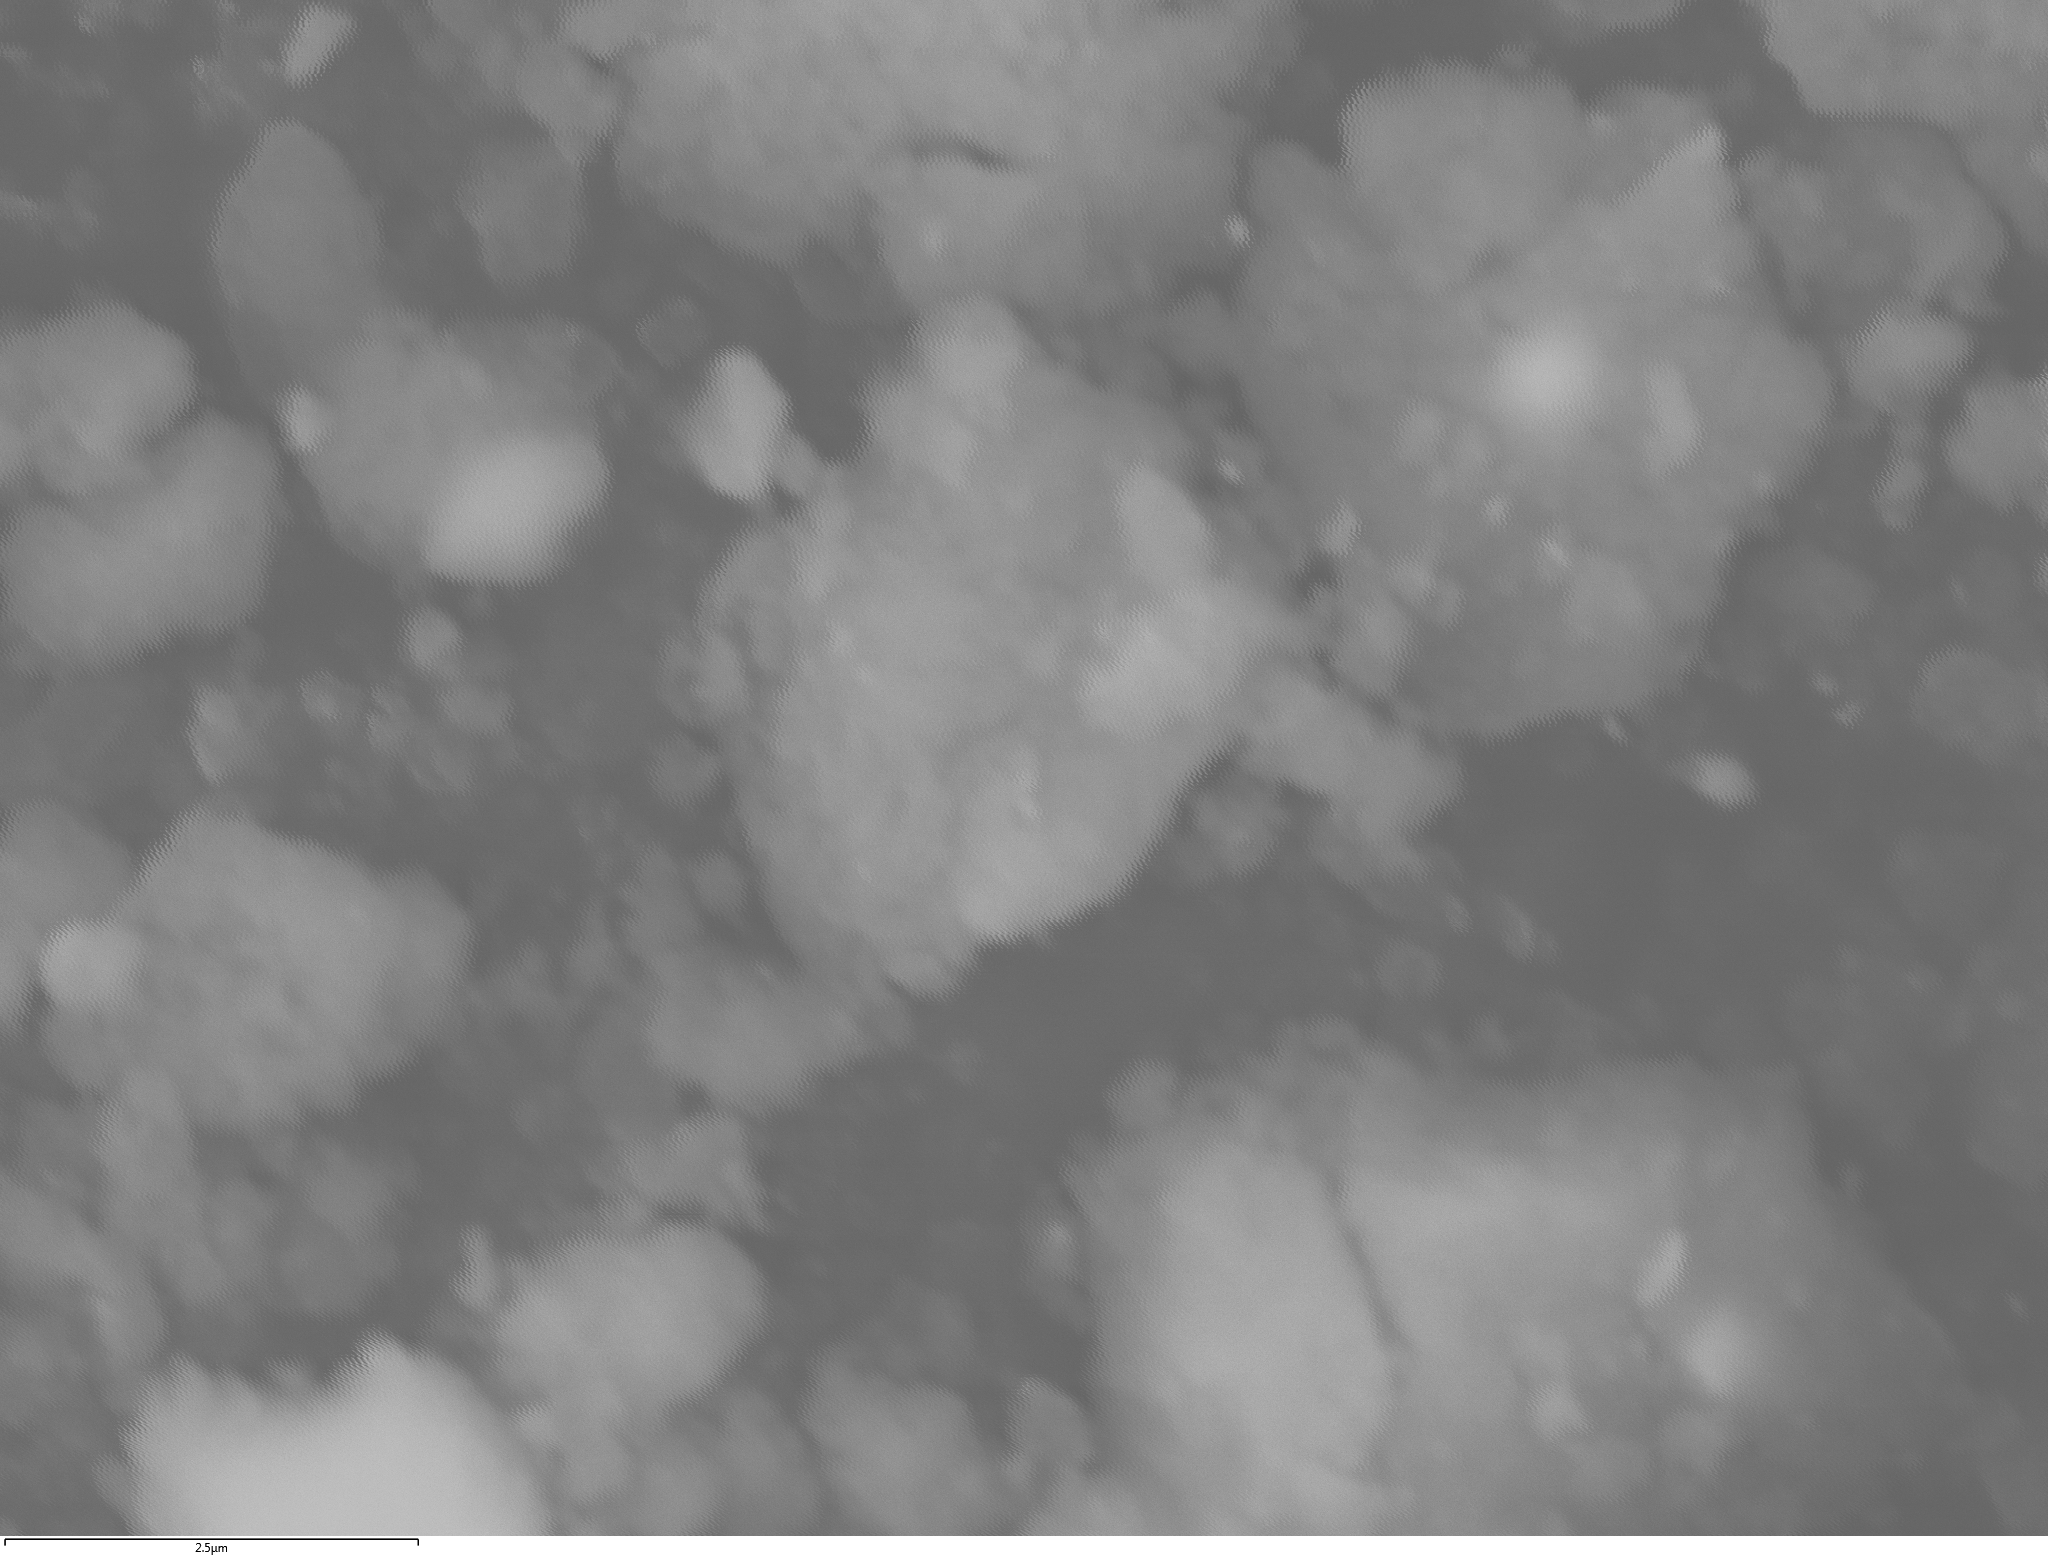
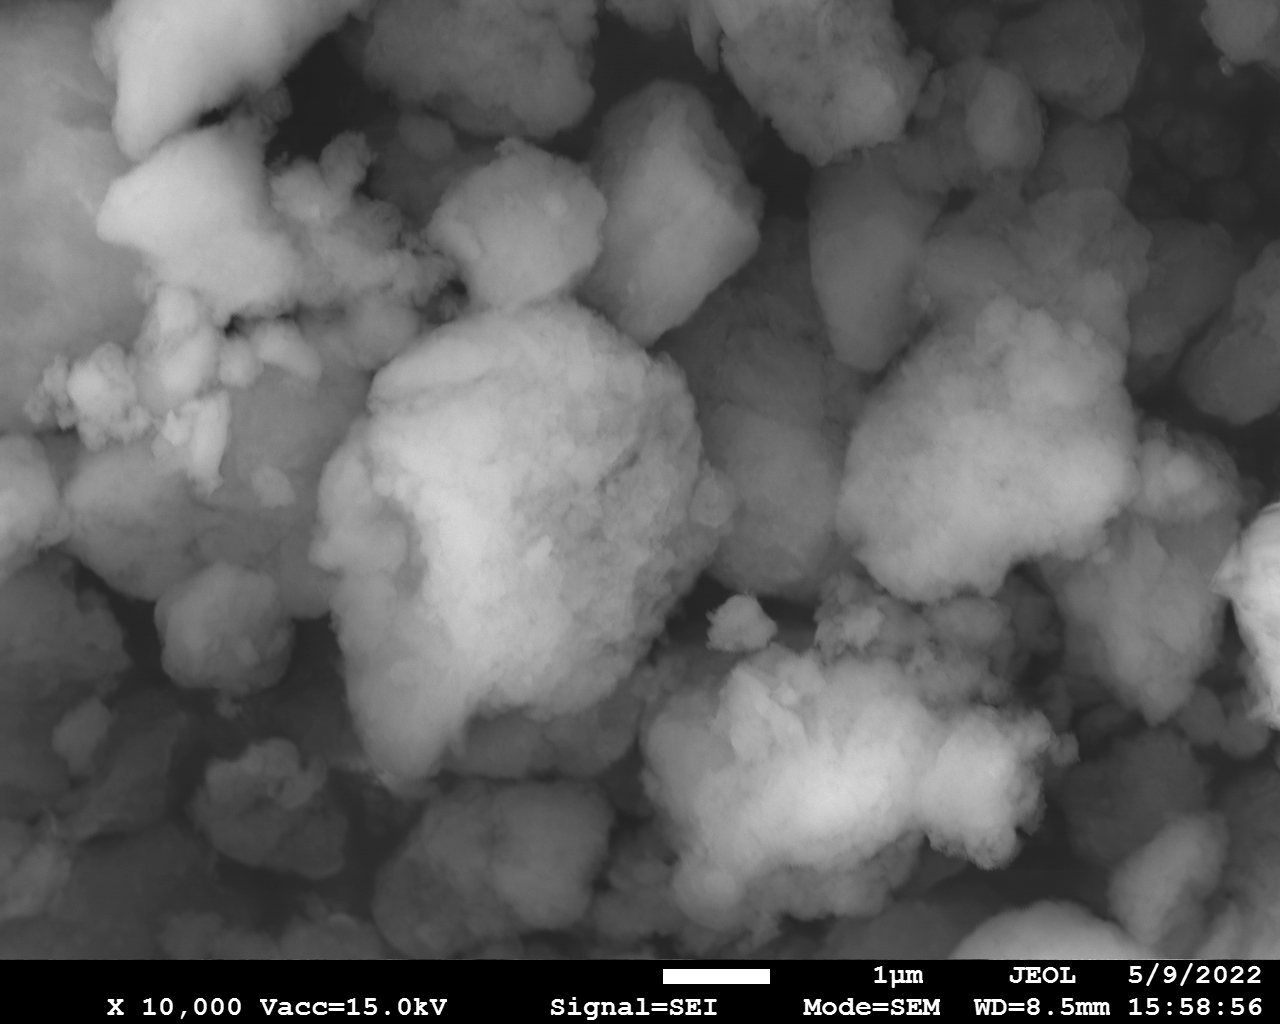
SEM
Samples consist of particles with up to 1-5 μm in size. There is increased porosity of samples and signs of BN exfoliation.
 |
 |
 |
 |
 |
 |
| dl124: GA:BN=1:7 |
dl125: GA:BN=1:3 |
dl120: GA:BN=1:1 |
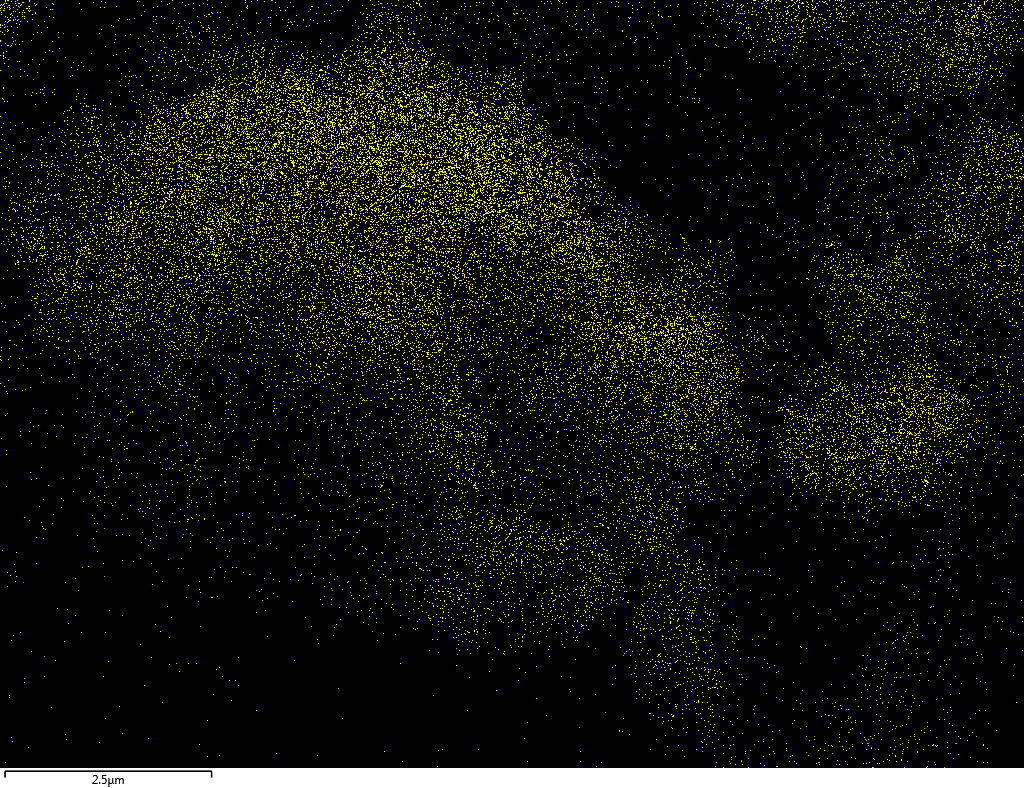
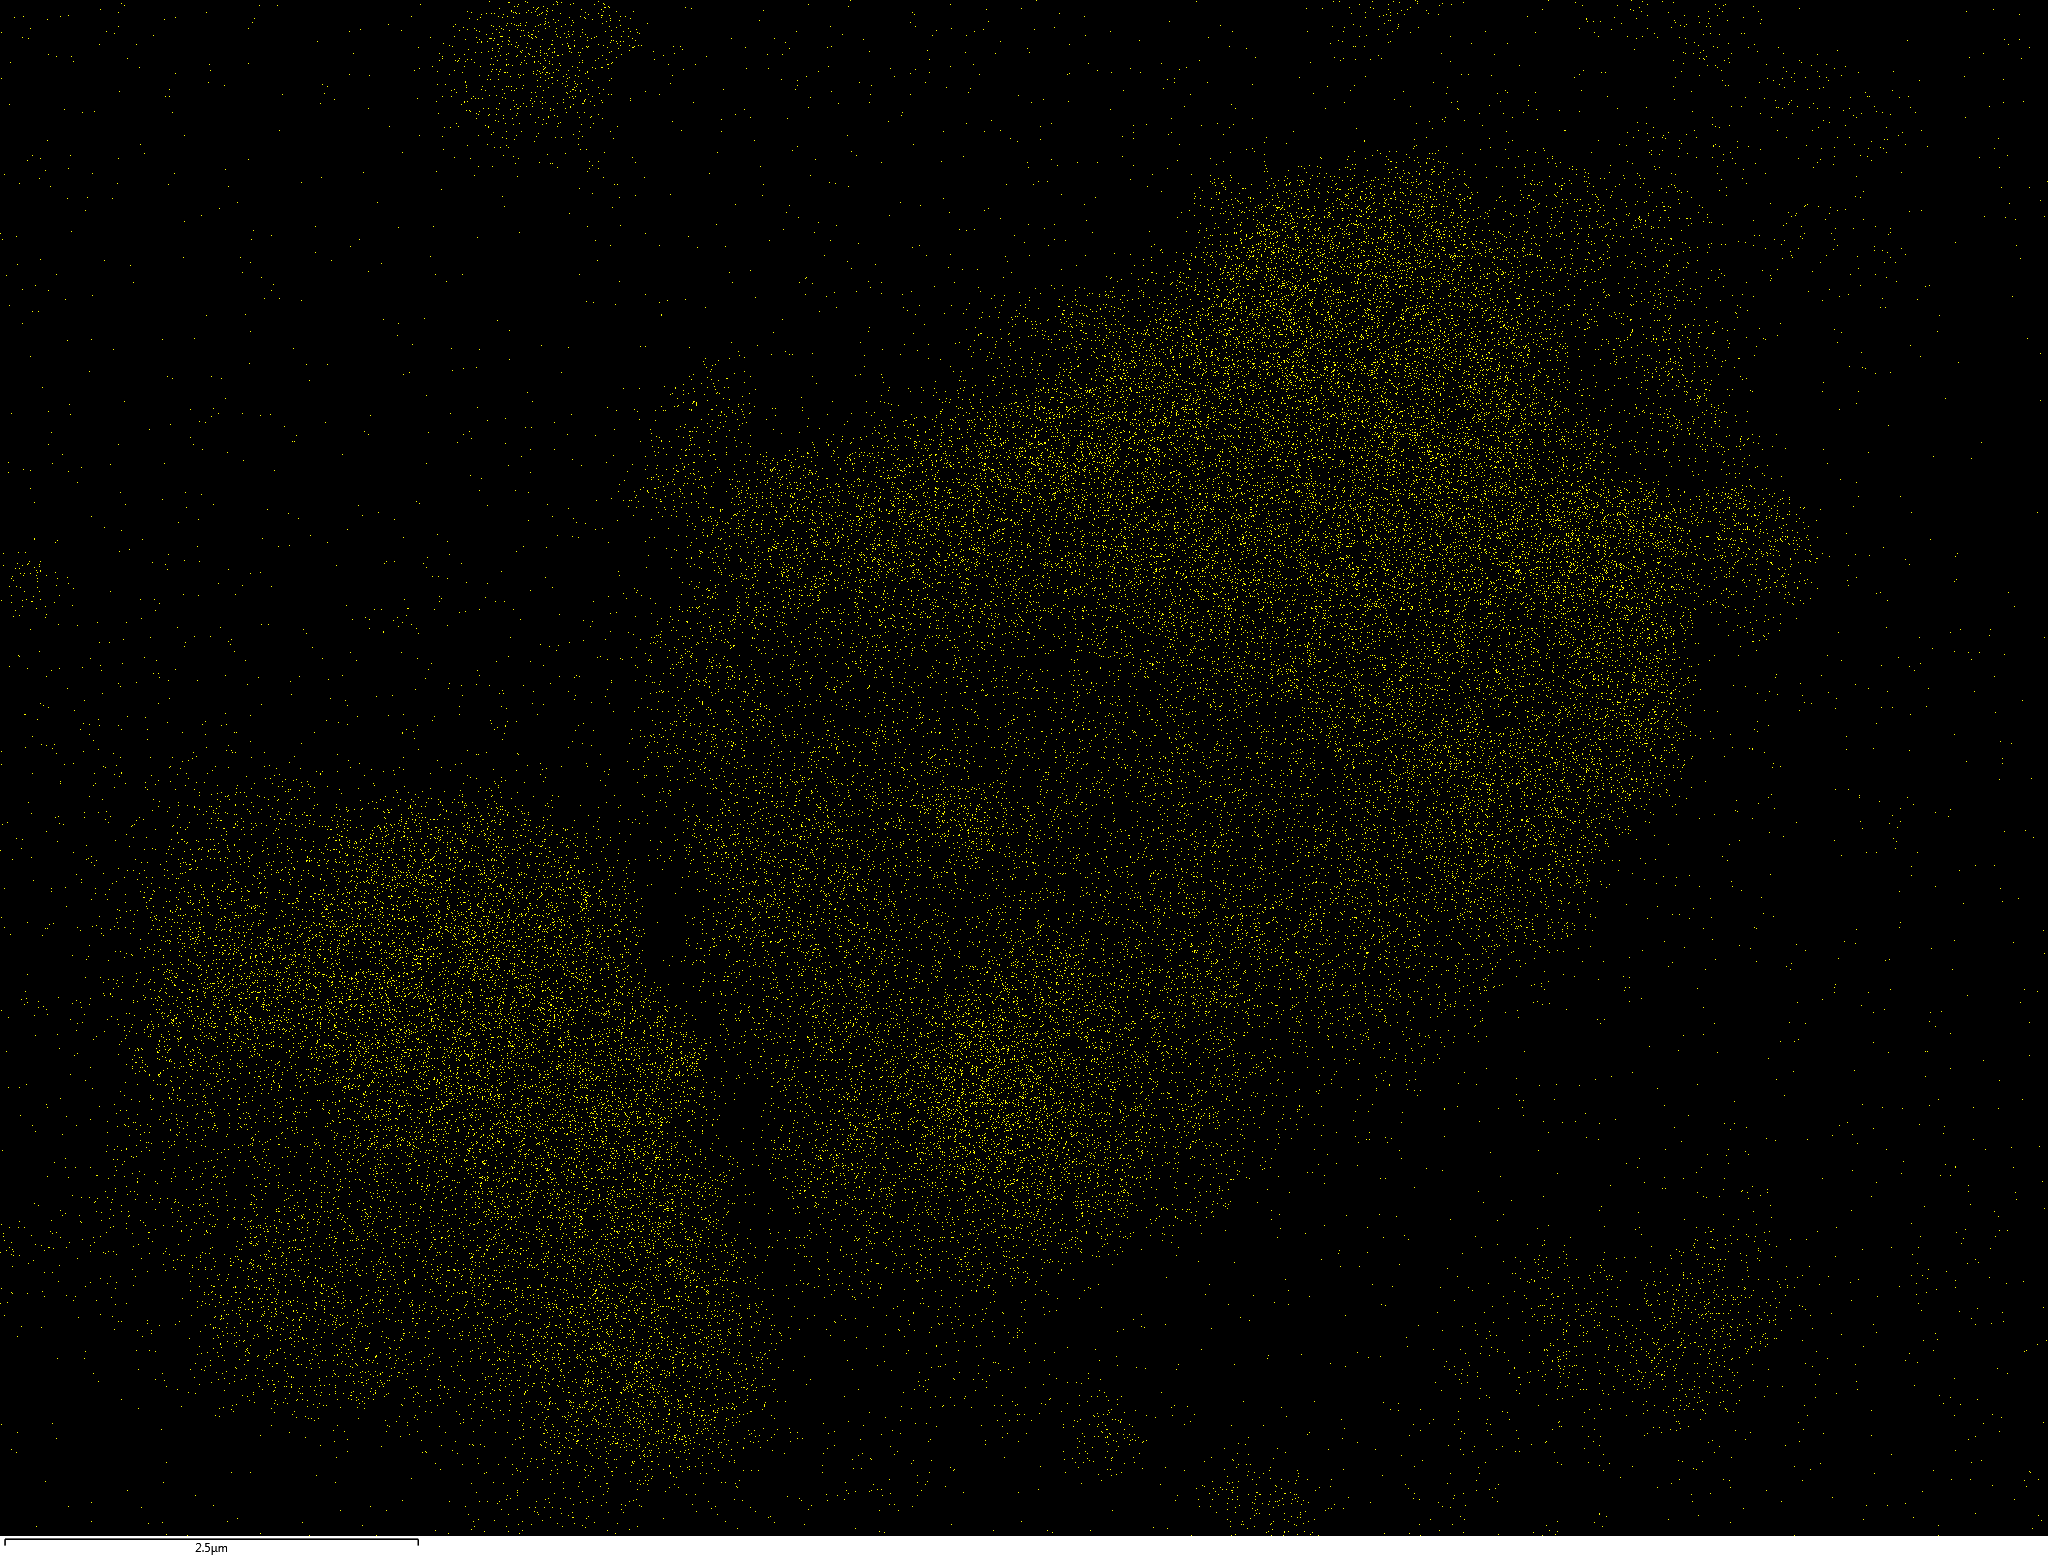
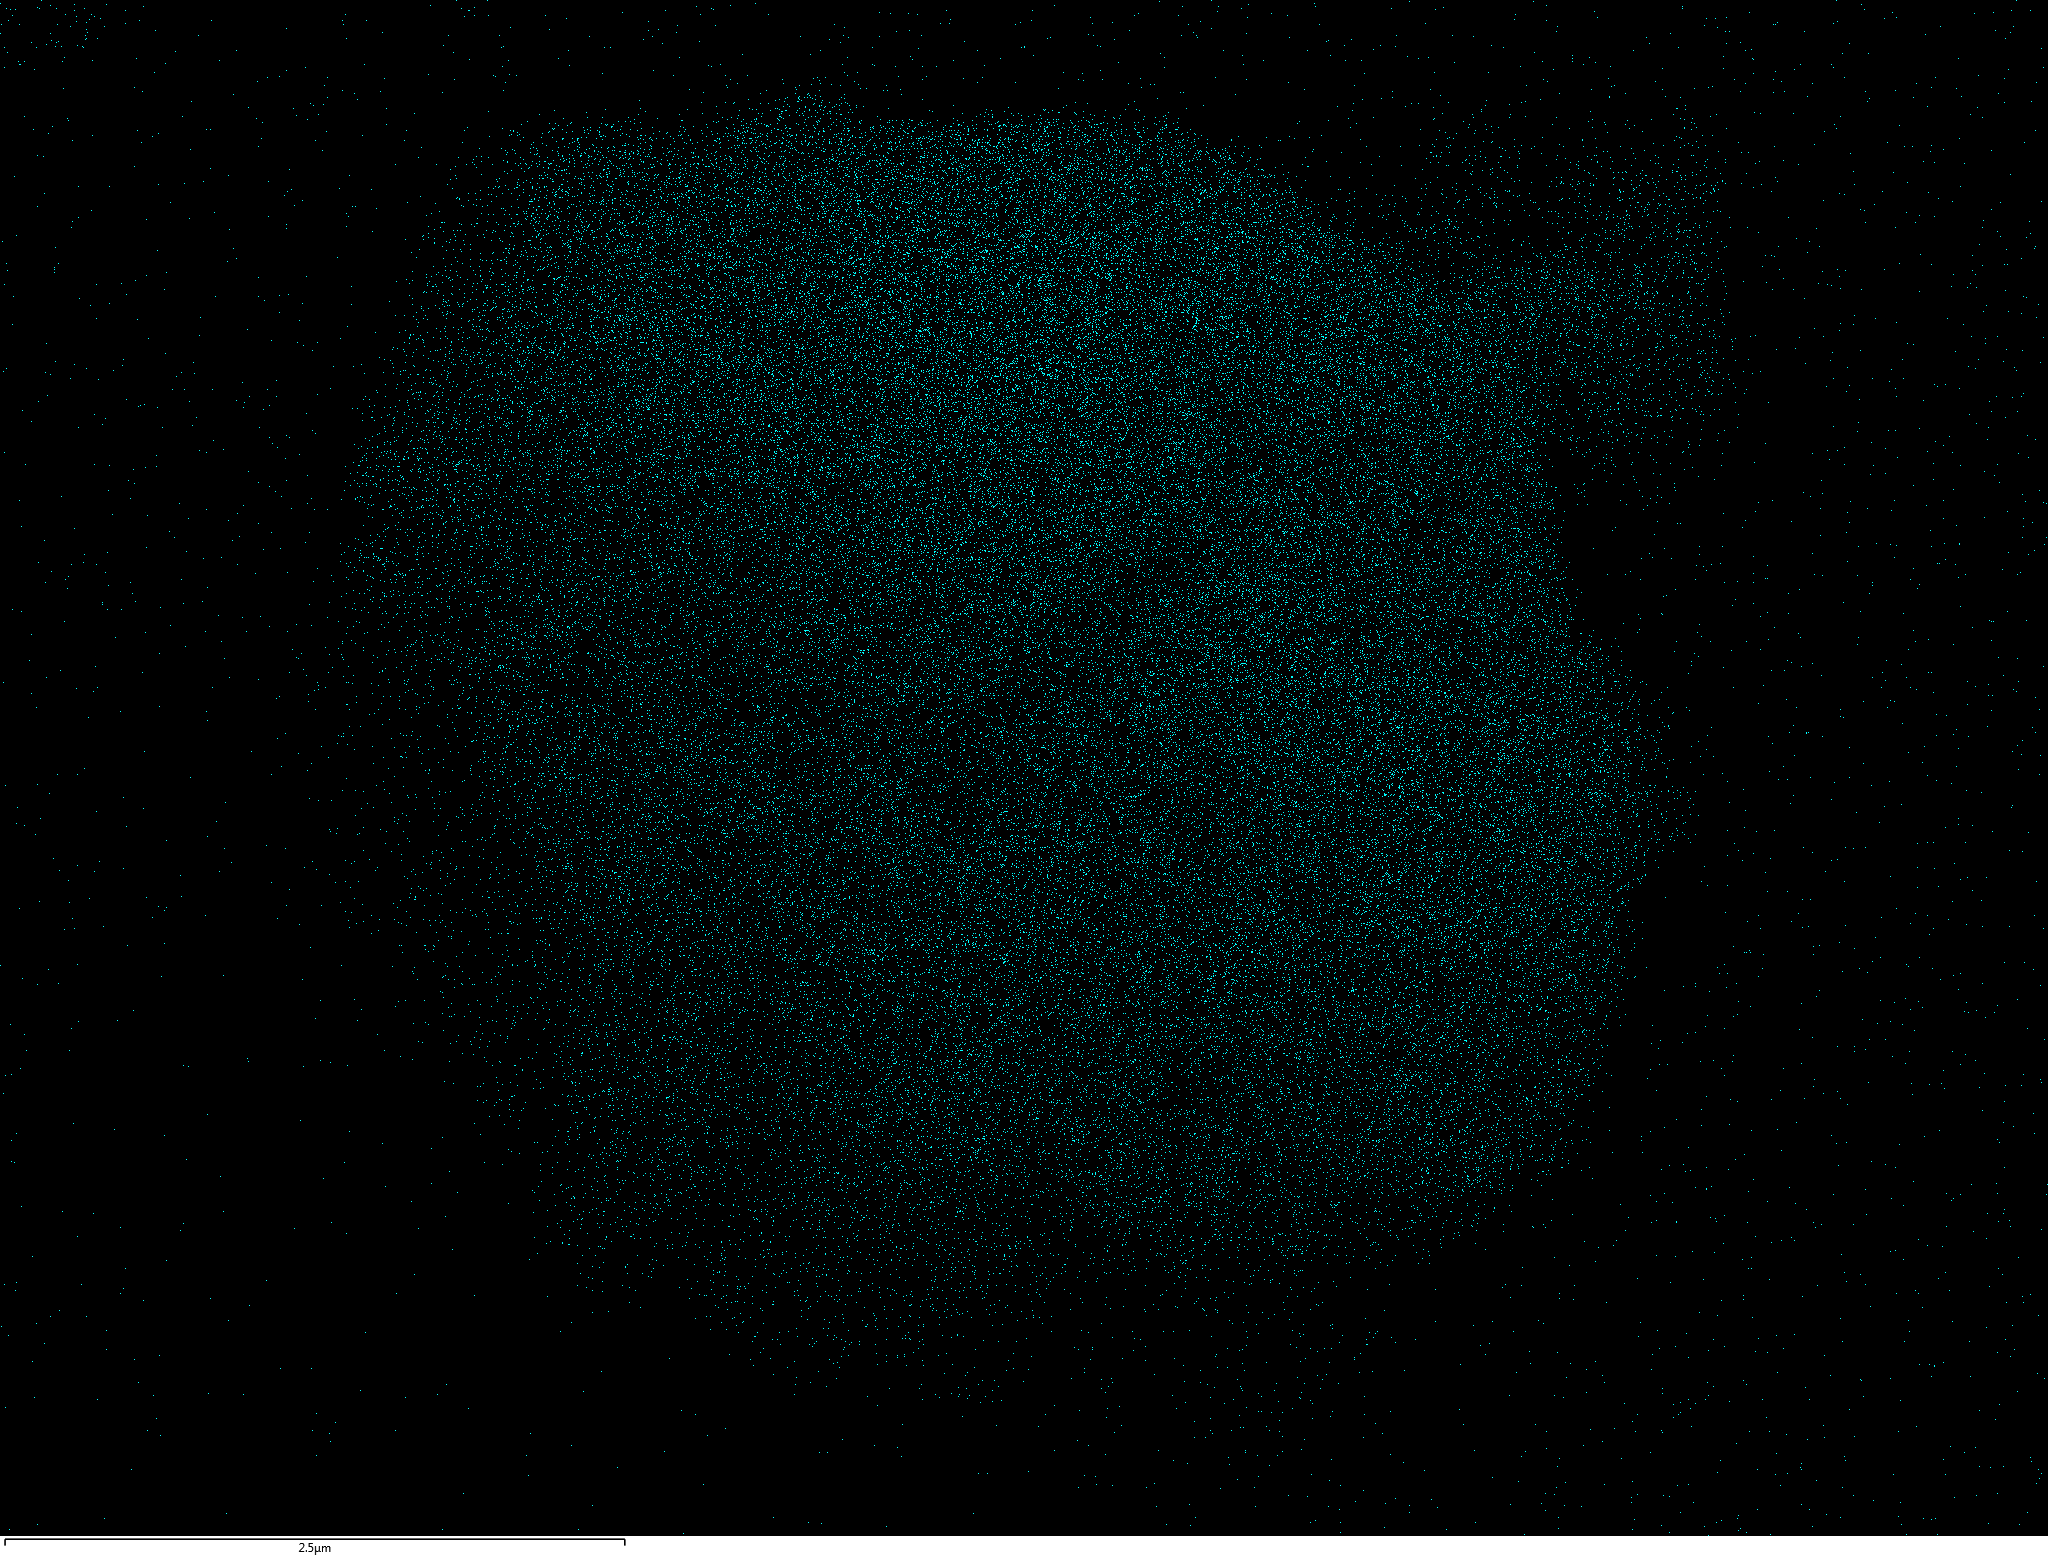
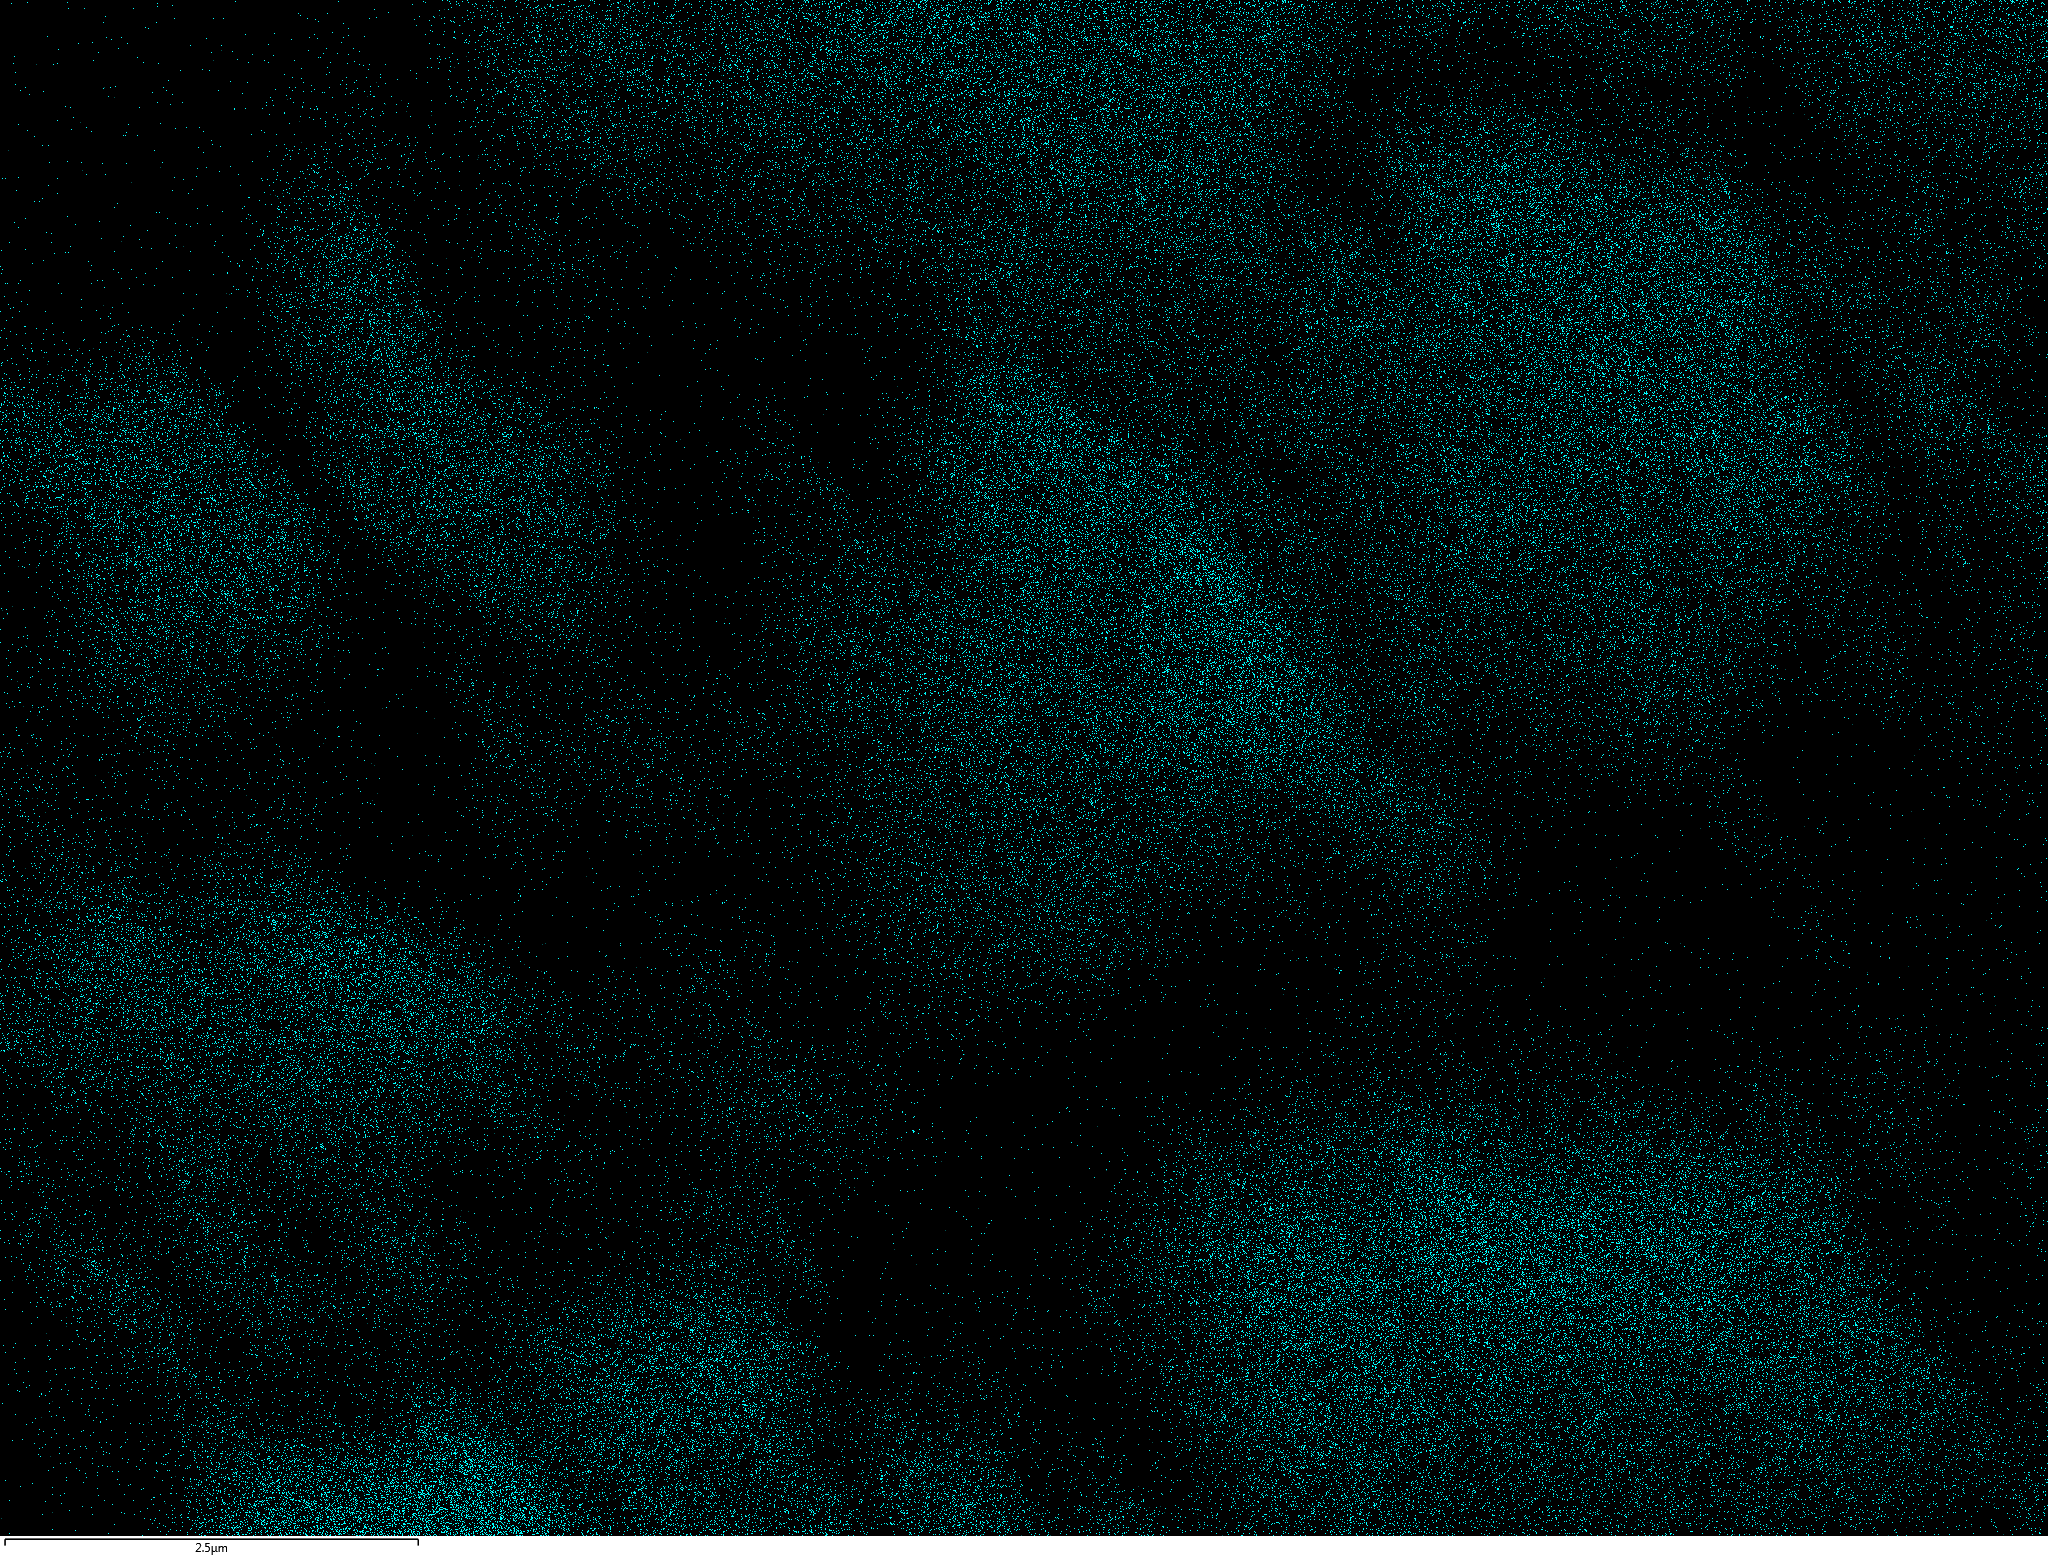
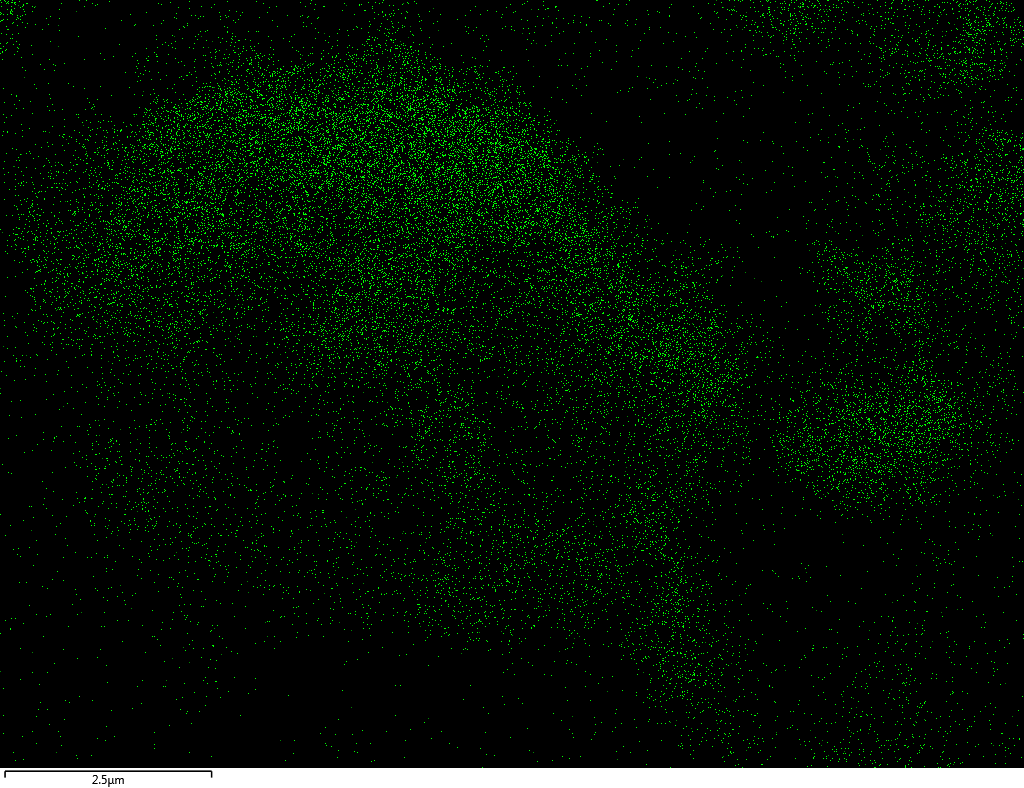
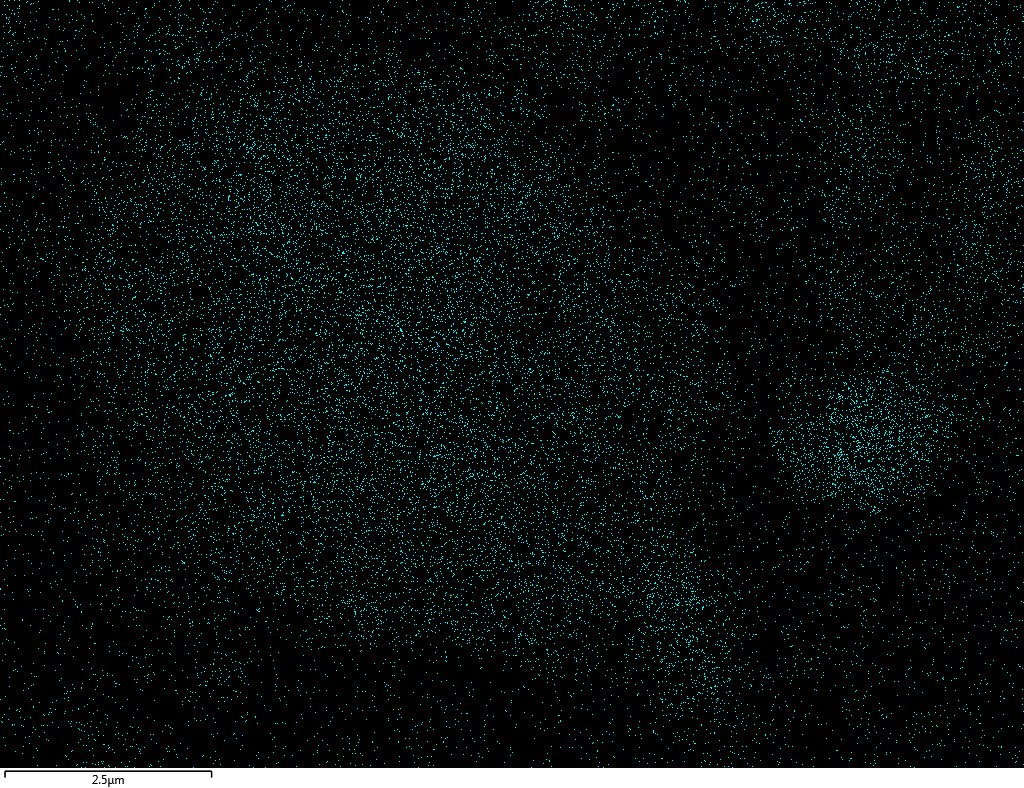
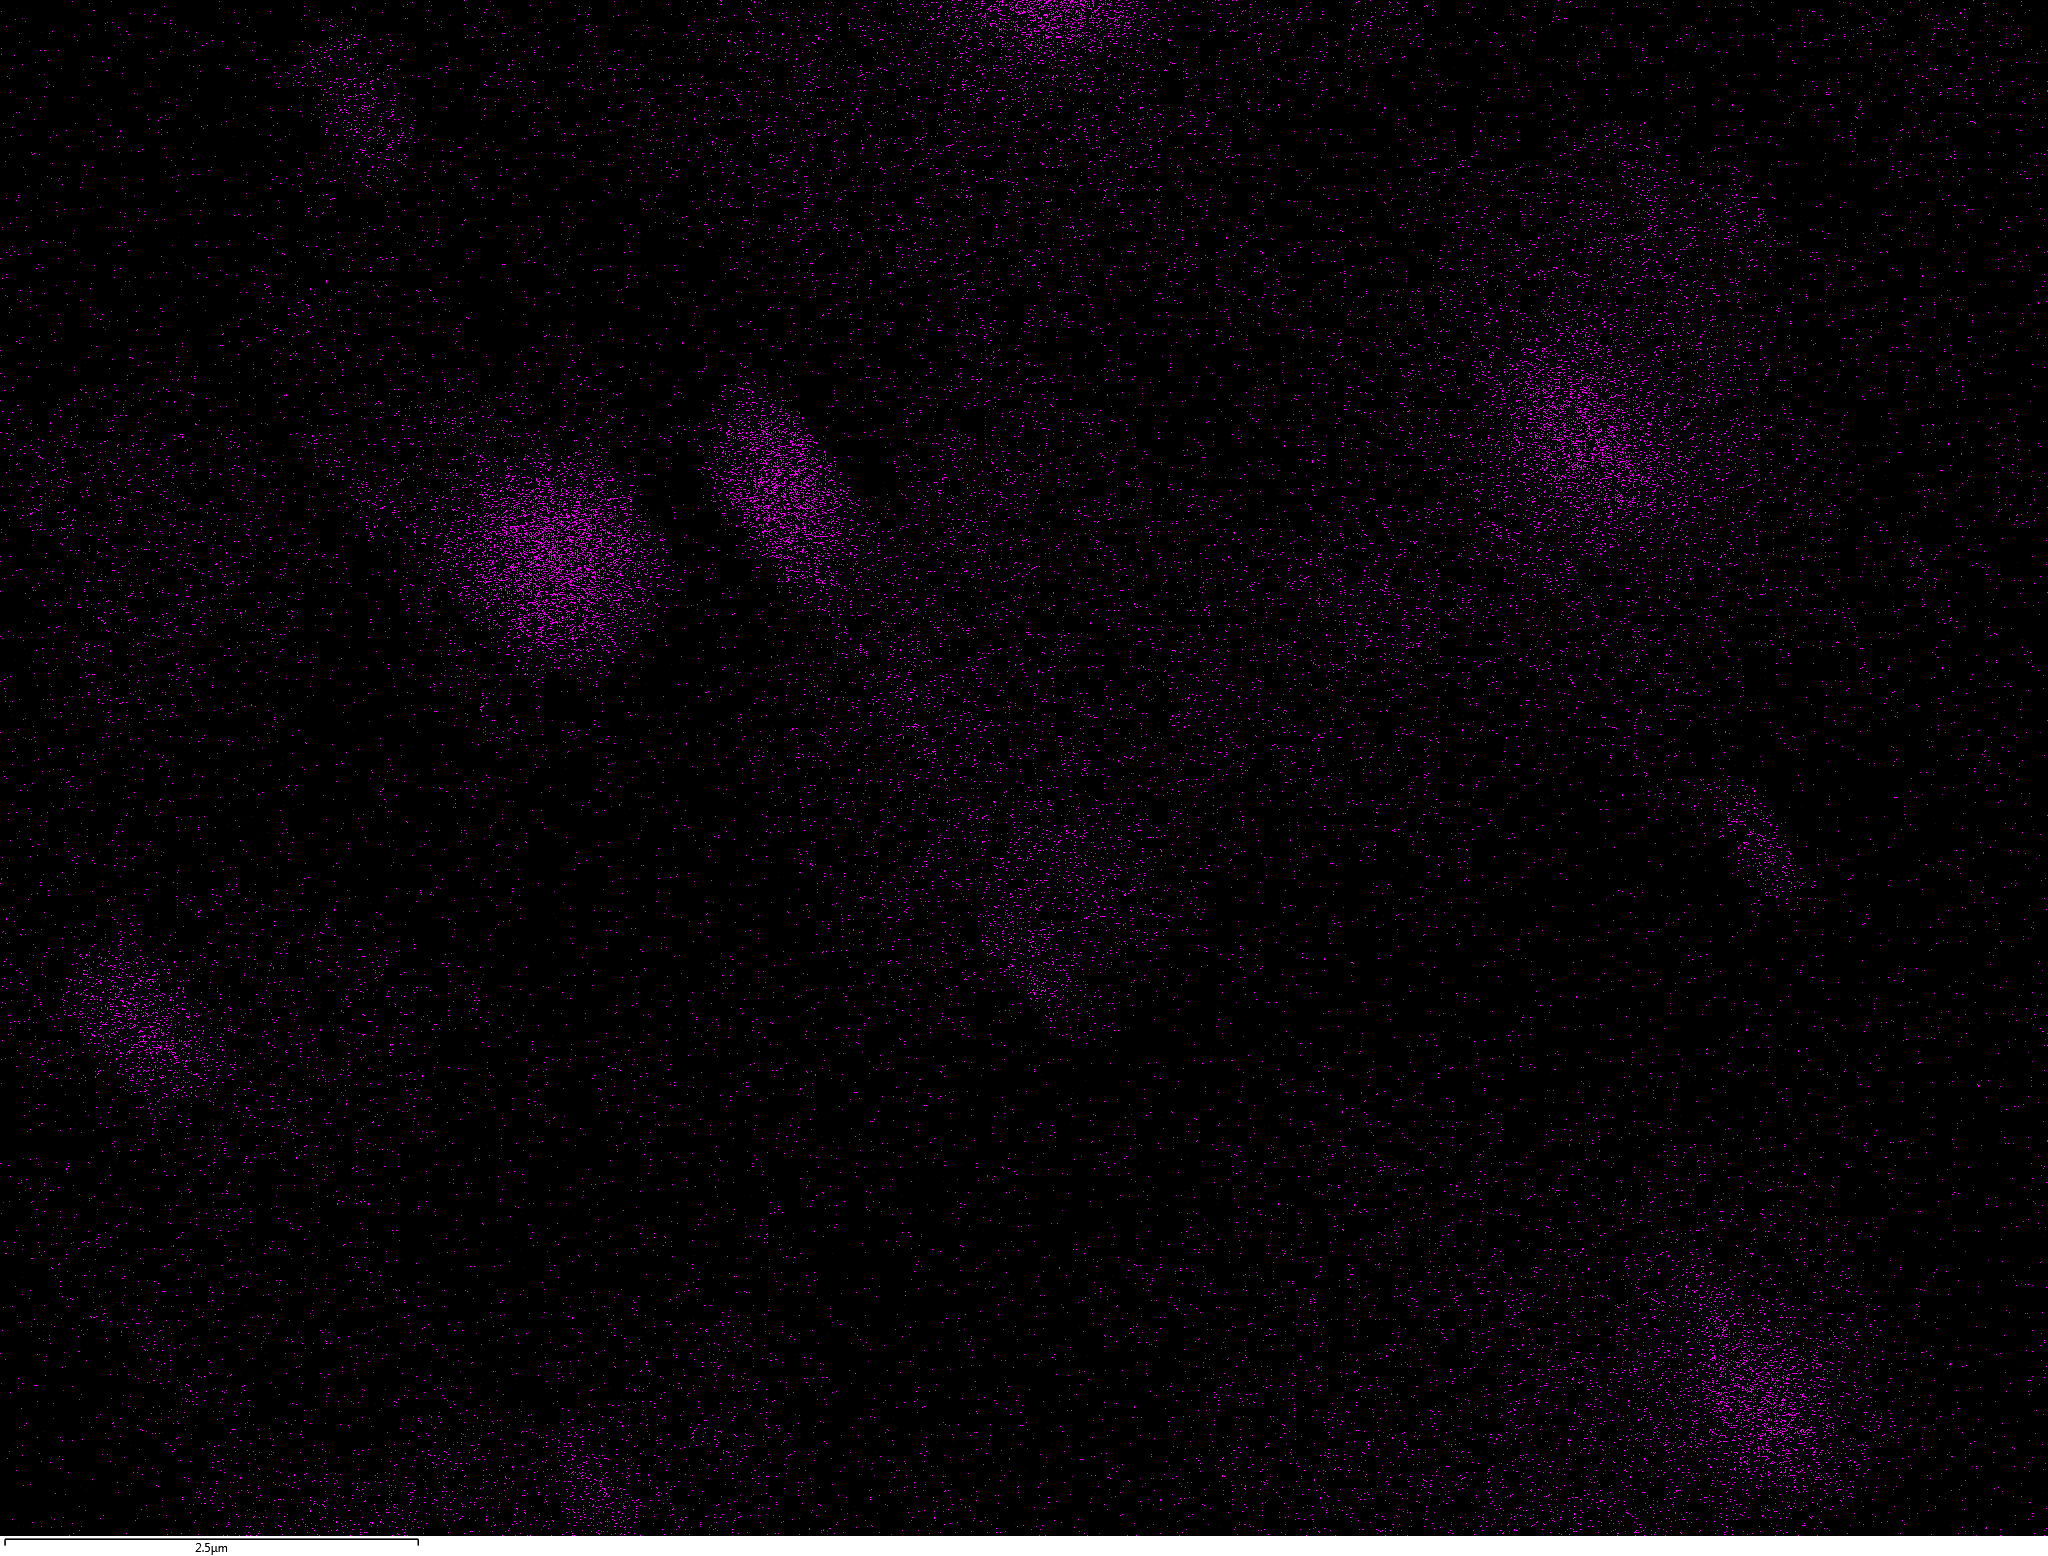
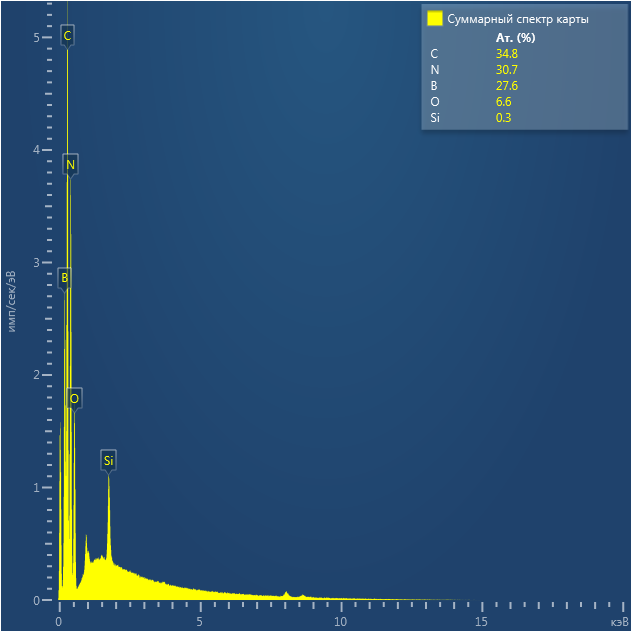
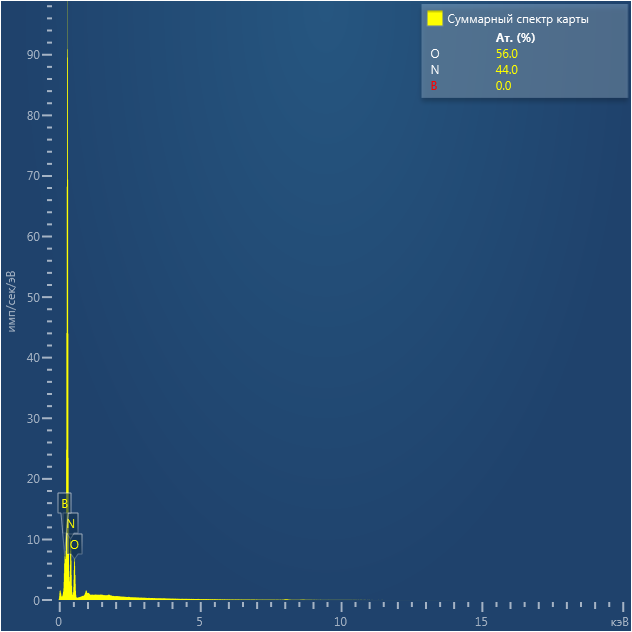
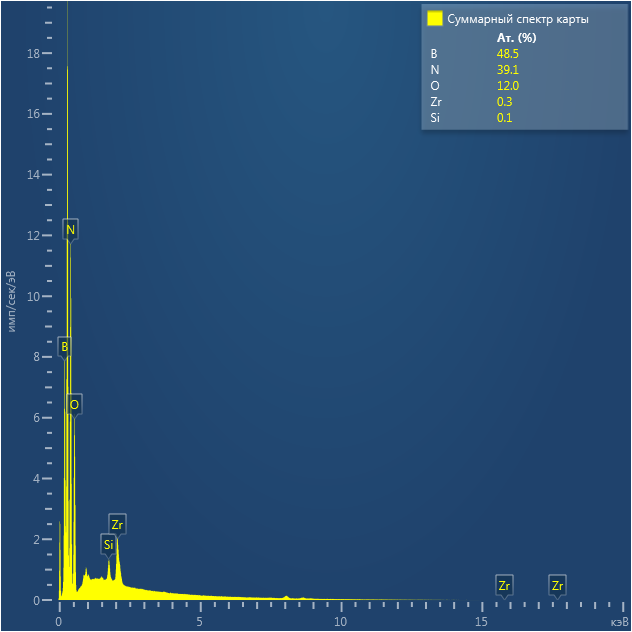
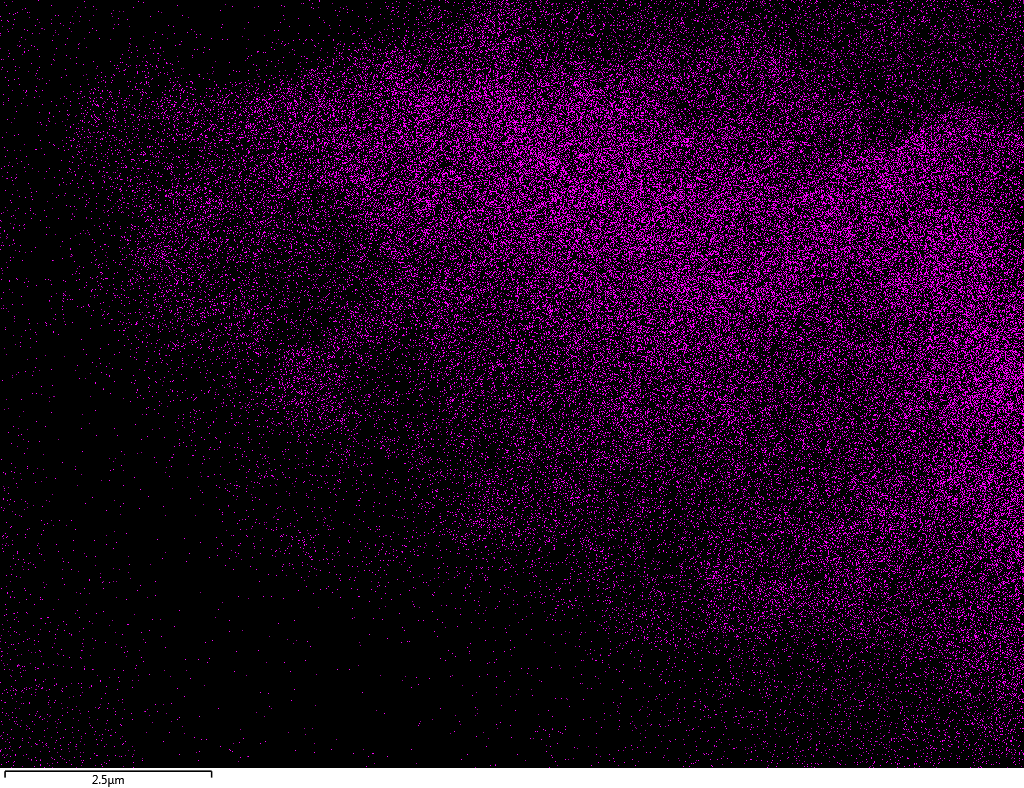
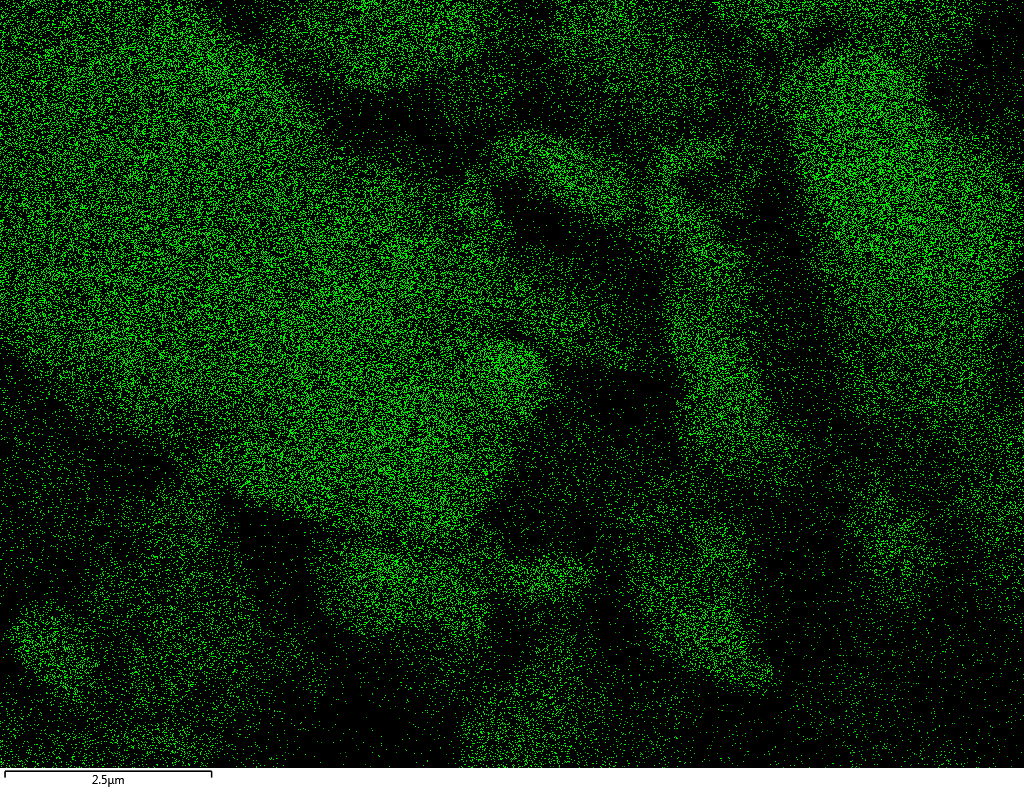
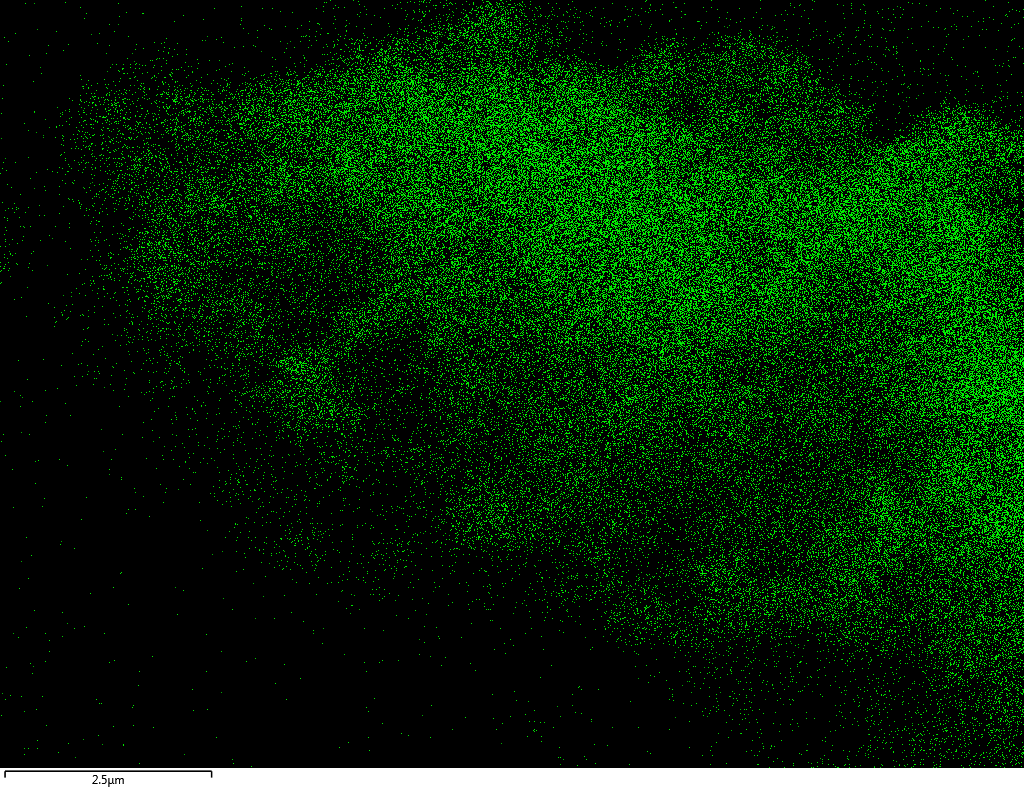
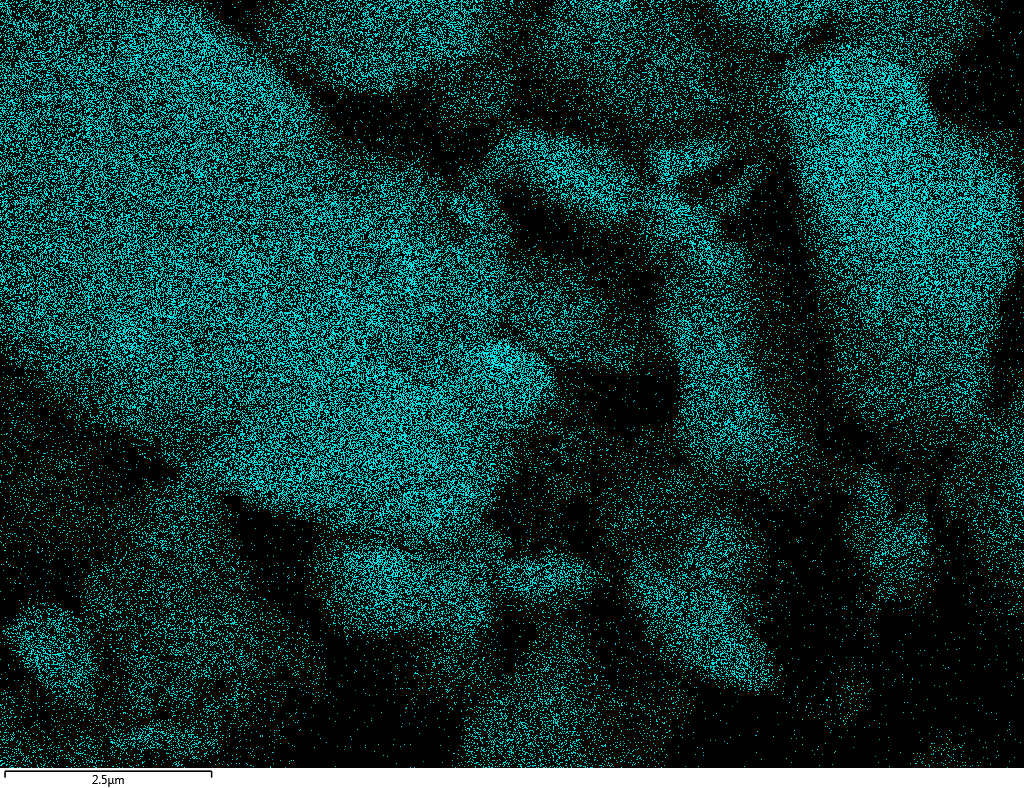
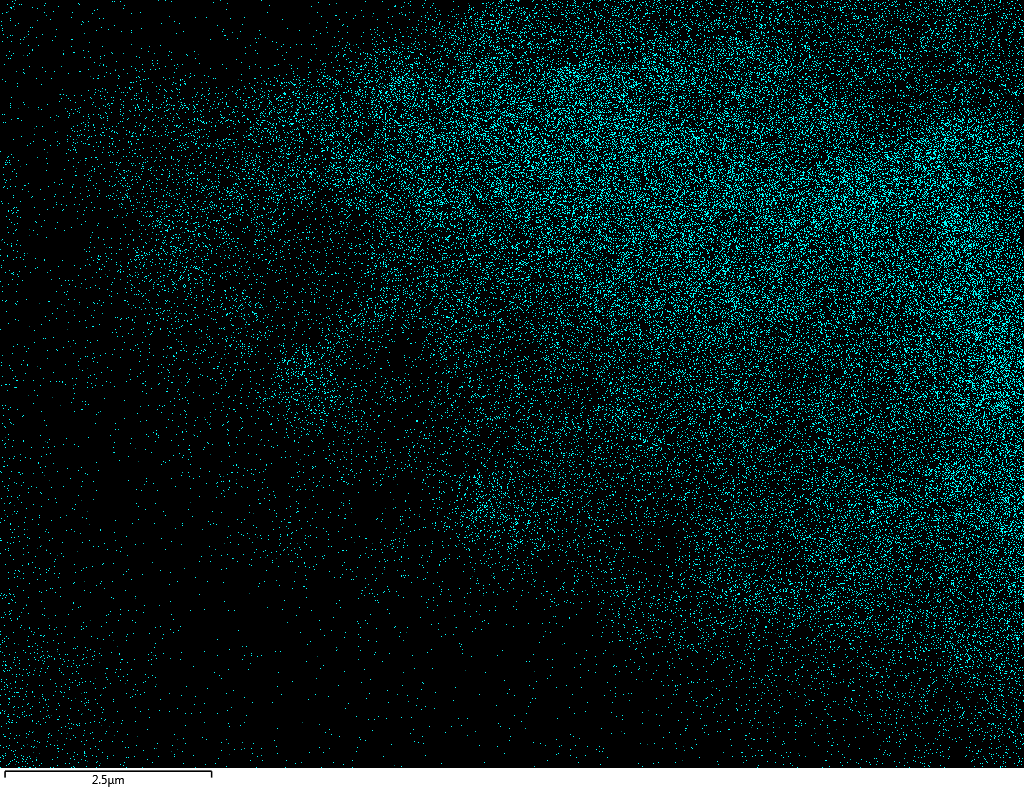
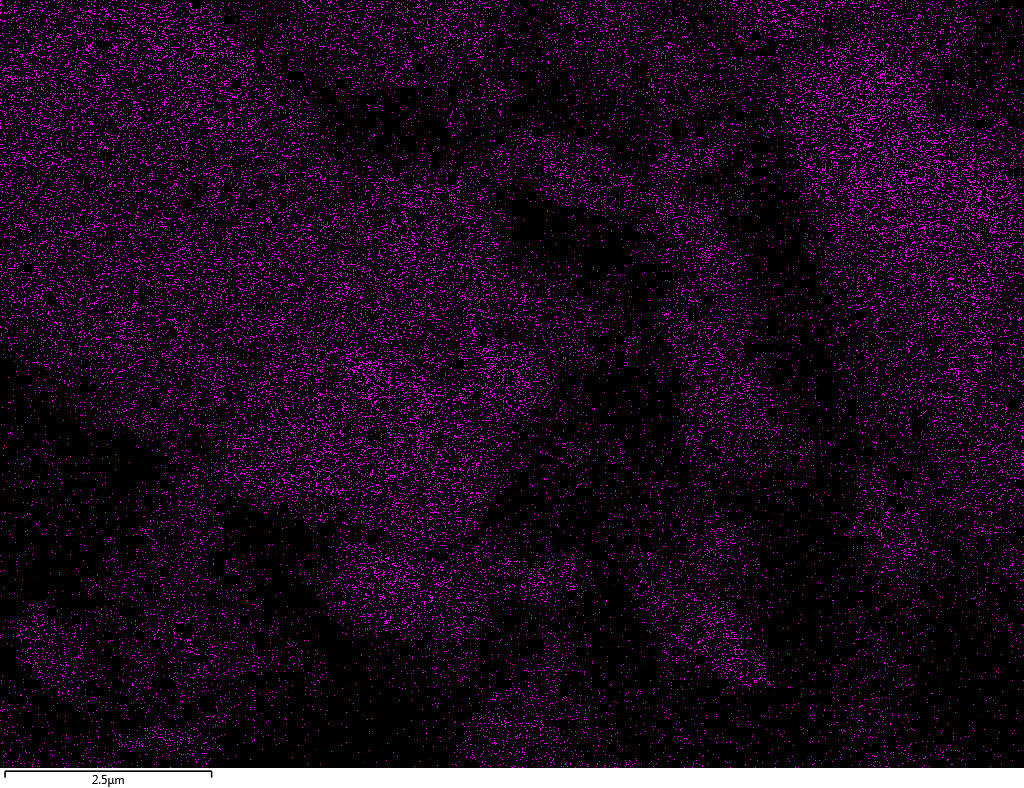
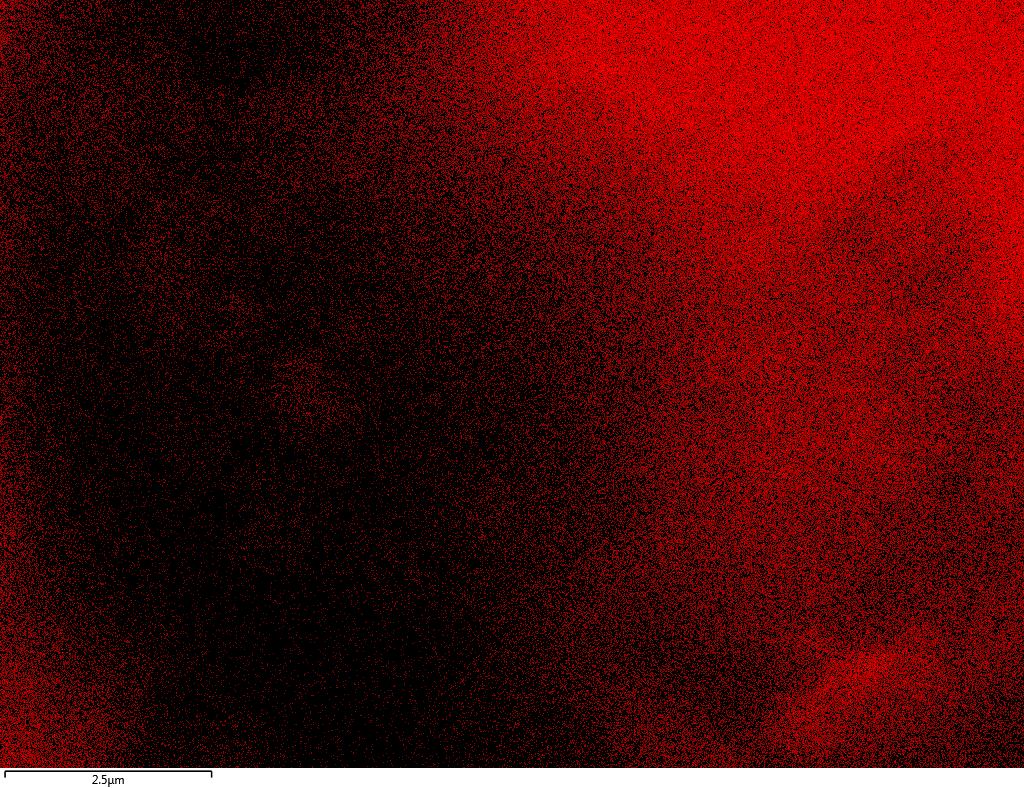
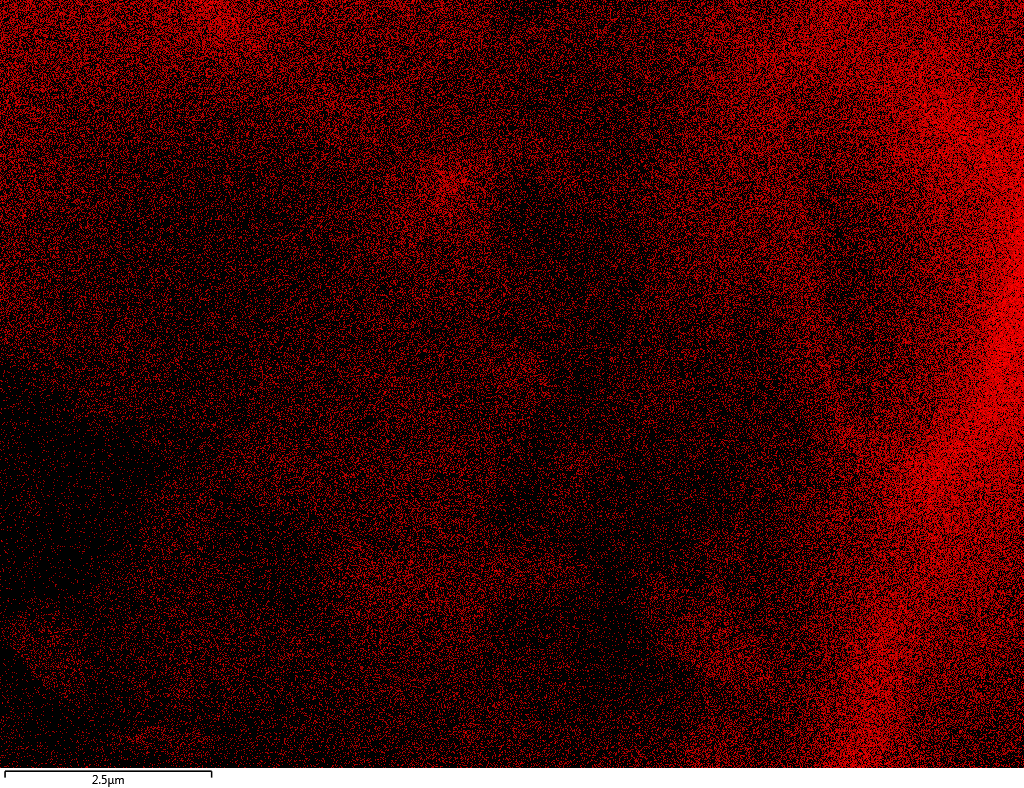
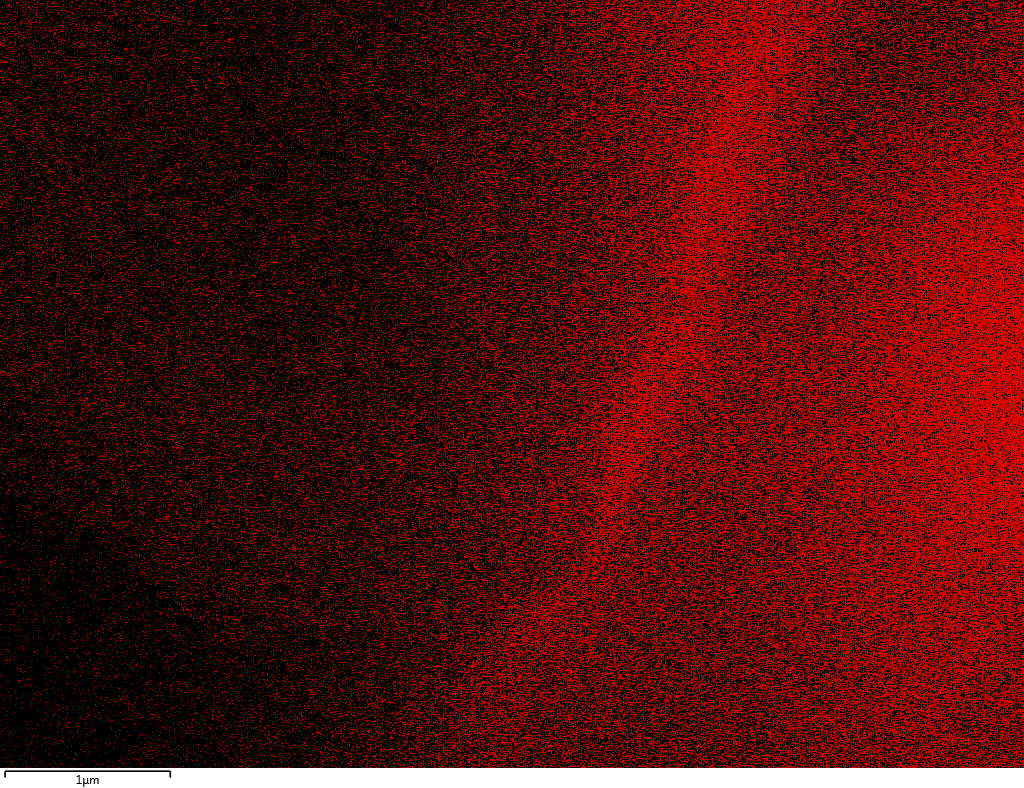
EDX
Samples consist of B, N, O elements without impurities. There is no obvious correlation between C on map and sem images.
|
 |
 |
 |
| B |
 |
 |
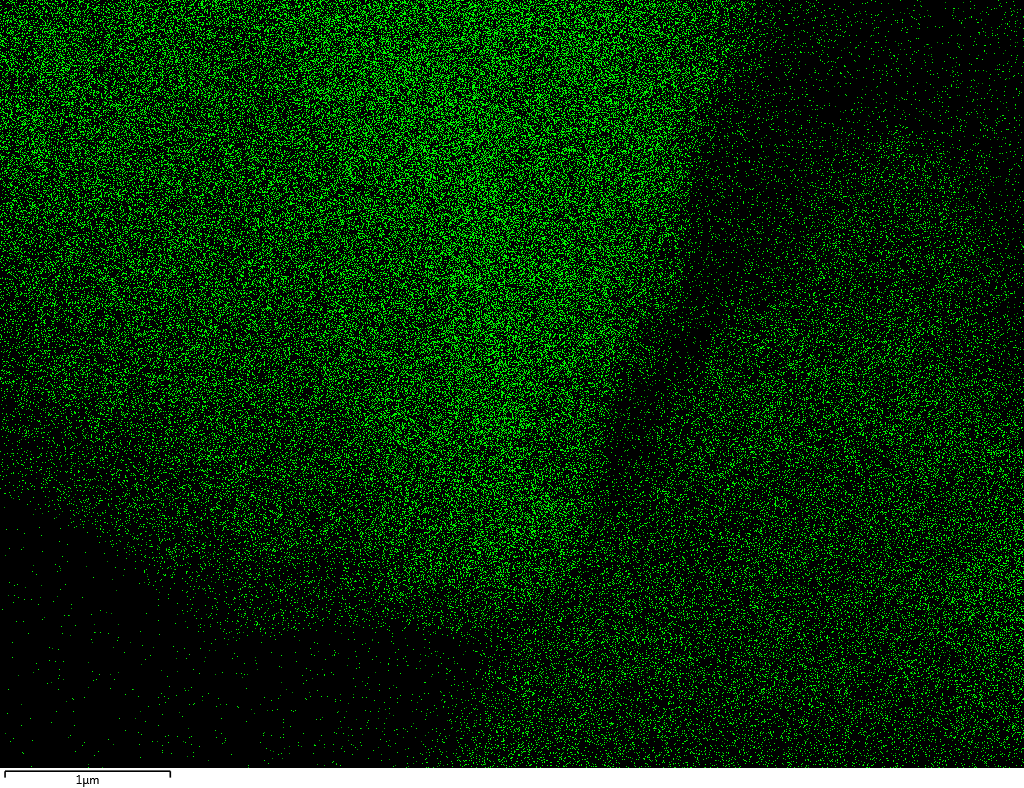 |
| N |
 |
 |
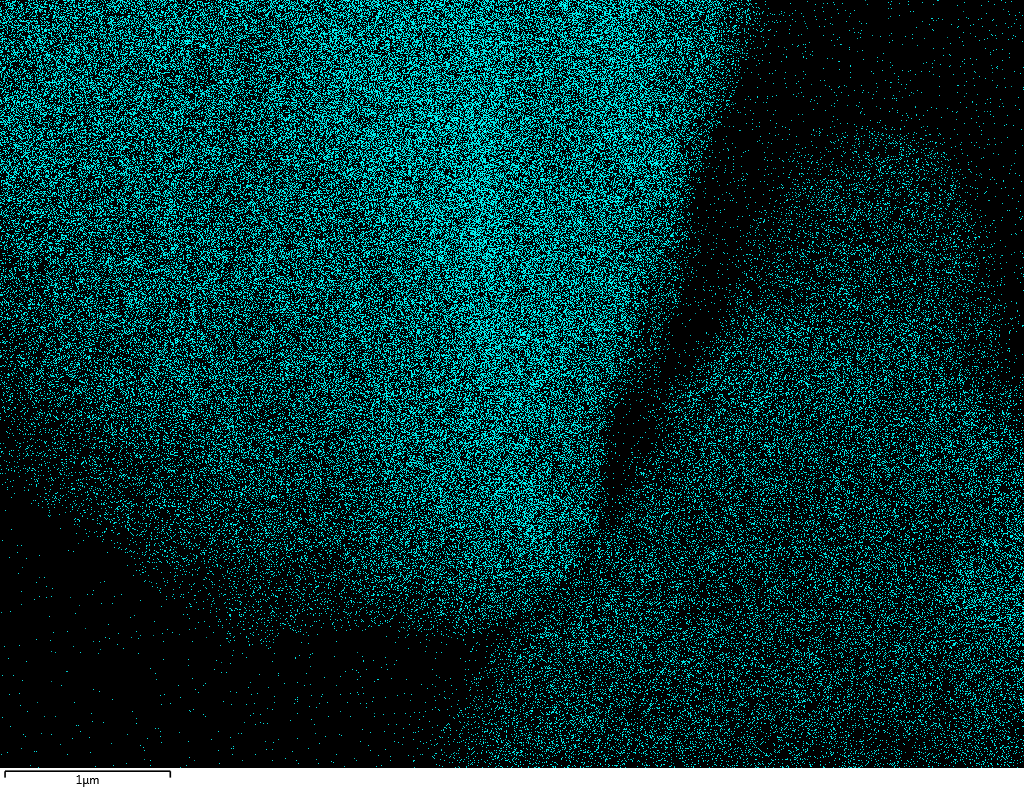 |
| O |
 |
 |
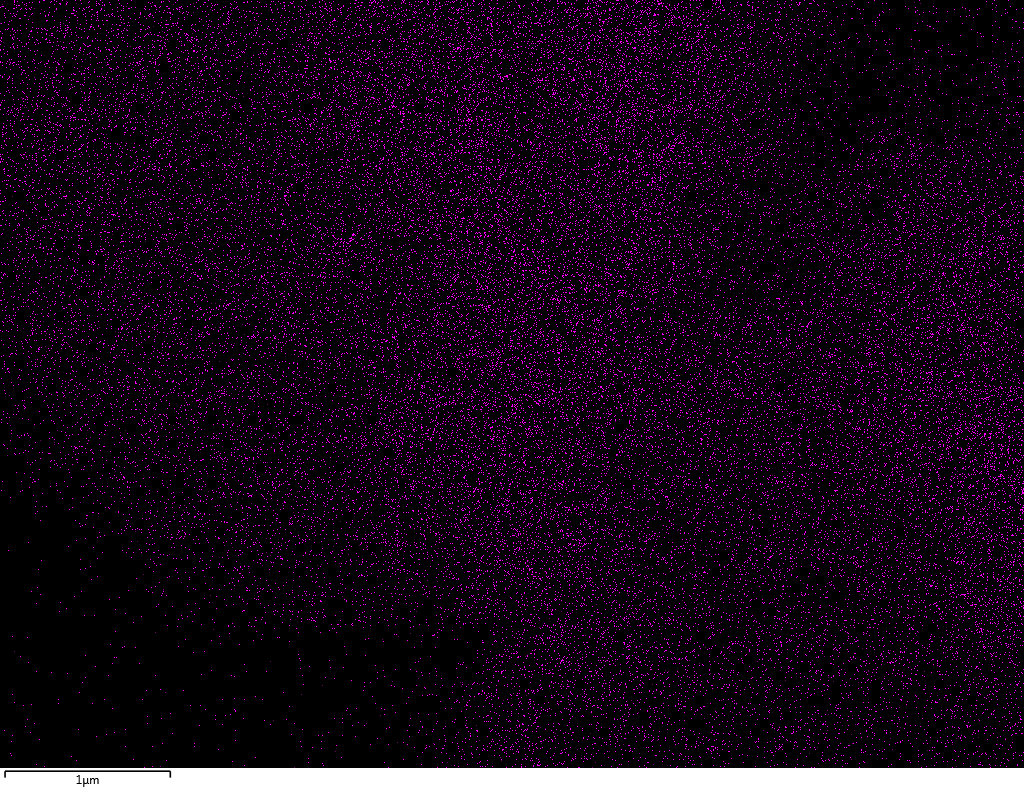 |
| C |
 |
 |
 |
|
dl124: GA:BN=1:7 |
dl125: GA:BN=1:3 |
dl120: GA:BN=1:1 |
Specific surface area
Specific surface area decreases from 278 to 171 and increases to 204 with increase of GA:BN ratio.
| Sample |
mGA:mBN |
Ssp |
|
mg:mg |
m2/g |
| dl119 |
1:15 |
278.256 |
| dl124 |
1:7 |
213.865 |
| dl125 |
1:3 |
171.86 |
| dl120 |
1:1 |
204.214 |
How does atmosphere of synthesis influence crystal structure and morphology of BCN produced by anneal of H3BO3 and hexamethylenetetramine mixture?
XRD
Anneal of boric acid and hexamethylenetetramine mixture in air result in BN and H3BO3 phases with low FWHM. Changing atmosphere to ammonia result in broad BN peaks without boric acid impurities. (002) peak is shifted to lower Bragg's angle which indicates increase of d-spacing.

How does ratio of H3BO3/hexamethylenetetramine influence characteristics of produced sample?
XRD
Sample with low C/B ratio consist of boron nitride and low amount of ammonium borate. Increase of C/B ration leads to the disappearance of ammonium borate, resulting sample consist of BN with increased d spacing.

Pulse titration and TPD
Sample, produced via decomposition of hexamethylenetetramine/boric acid mixture in ammonia atmosphere at 700C for 4 hr, showed little CO2 adsorption capacity and absence of desorption peaks up to 500C.
| sample |
C/B ratio |
CO2 adsorption |
|
|
μmol/g |
| dl502 |
2 |
0.688 |
 |
| dl502: C/B = 2 |